Is PSPP A Free Alternative To SPSS?


PSPP is a free alternative to SPSS, offering similar functionality and user interface. It covers the most common analyses and is well-suited for more straightforward tasks. However, it lacks advanced graphical capabilities compared to SPSS.
Have you heard of PSPP? We have great news for those who want to use the popular statistical package SPSS for data analysis and graphing but cannot afford it!
This article will introduce you to PSPP, a free software package created as an alternative to SPSS, offering a similar graphical user interface!
Today, there is a plethora of statistical packages available. Among the most popular is SPSS. The problem is that its price is a prohibitive factor for many people.
The annual subscription price can range between $1,290.00 and $5,730.00, from the basic to the full version — the monthly base subscription costs $99.00.
Due to its high price, most users opt for free statistical programs that can only sometimes meet their needs.
An attractive solution would be a statistical package that is free, reliable, with a friendly graphical interface, easy to use, and includes a comprehensive analysis package!
PSPP is a free data analysis software designed as an alternative to SPSS. A remarkable feature is that its functions and graphical interfaces are very similar.
The software allows you to perform descriptive analysis, t-tests, ANOVA, linear and logistic regression, association measures, cluster analysis, factor analysis, reliability analysis, non-parametric tests, etc.
Below, we will explore PSPP and demonstrate how to perform some of the most commonly used statistical analyses.
Before you continue, download the PSPP for free by clicking here!
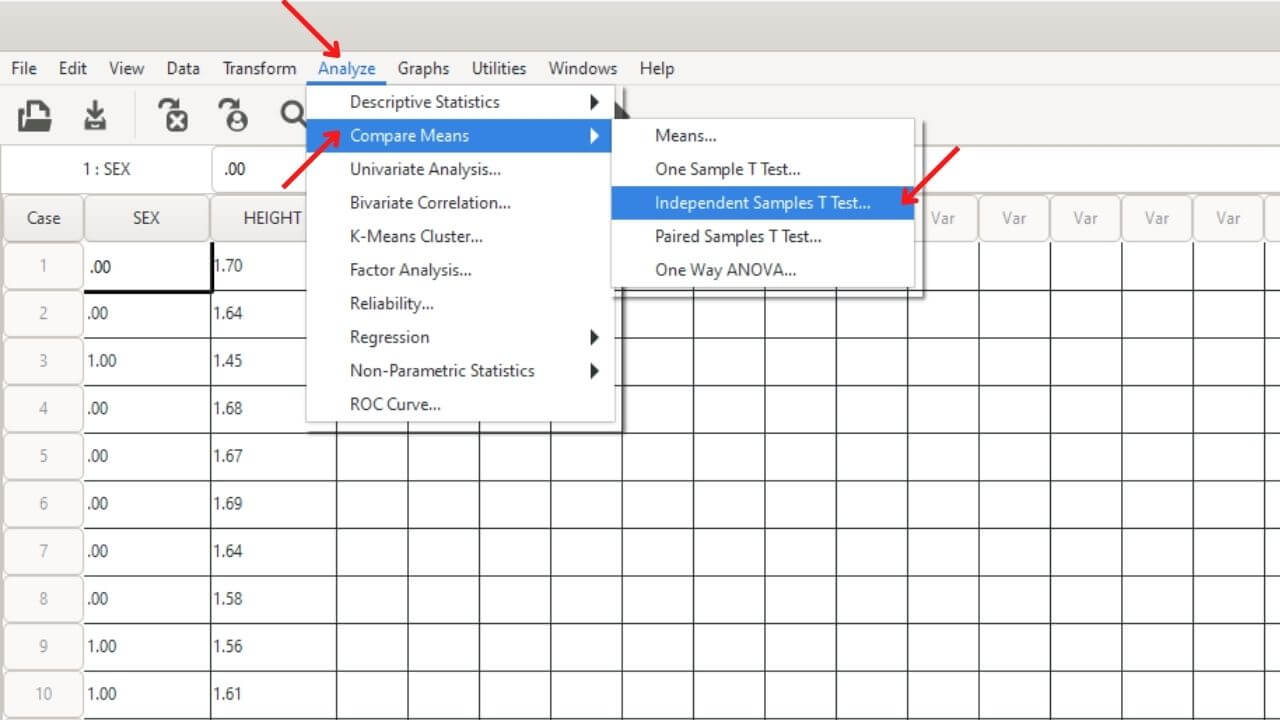
Upon opening PSPP, enter the data to be analyzed.
The data configuration is the same as in SPSS — each variable in a column and each sample in a row.
In the example, since we will compare two groups (men vs. women) regarding a quantitative variable (height in meters), we will have two columns: sex and weight.
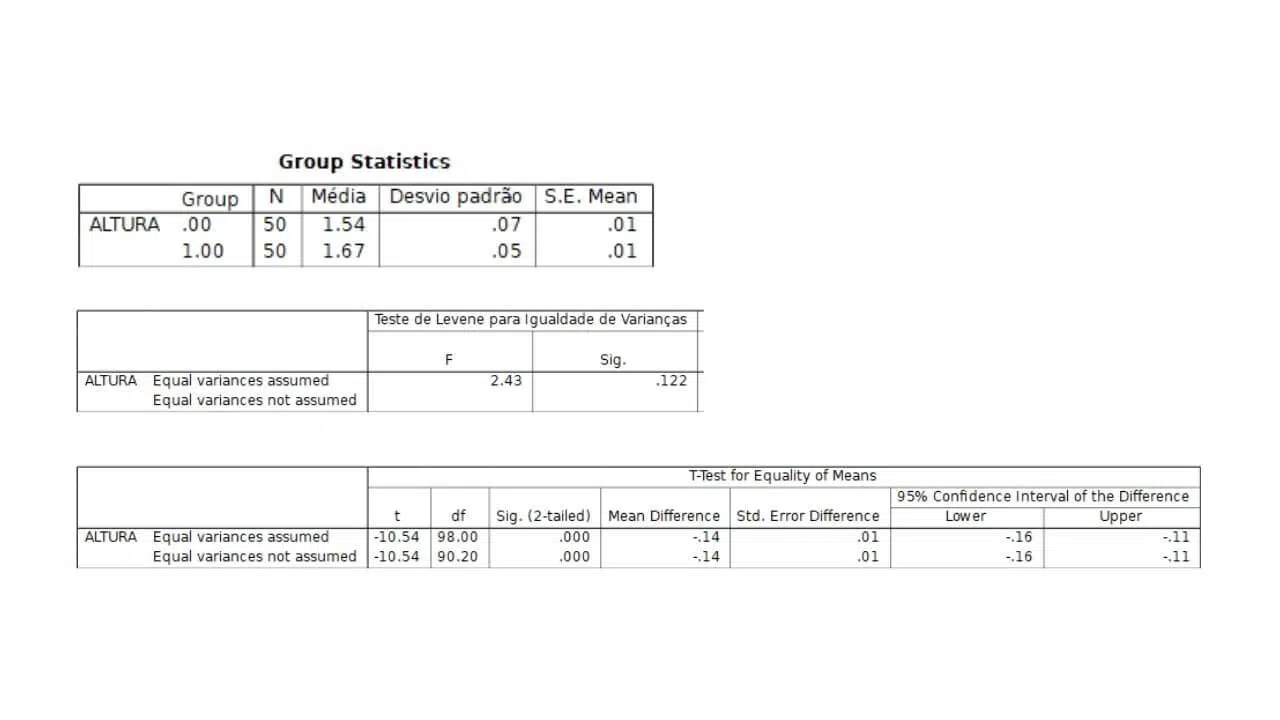
In the results below, note the following information:
(1) Levene’s test indicated that the data have equal variances (homoscedasticity) because the p-value was 0.122, i.e., greater than 0.05.
(2) Thus, as a result of our t-test, we should use the line indicated as “Equal variances assumed,” which had a p-value less than 0.001; that is, it was statistically significant.
(3) We conclude that there is a significant difference between the average heights of men (1.67 m) and women (1.54 m).
Don’t forget to check the normality of the residuals before starting this analysis — we will discuss this later.
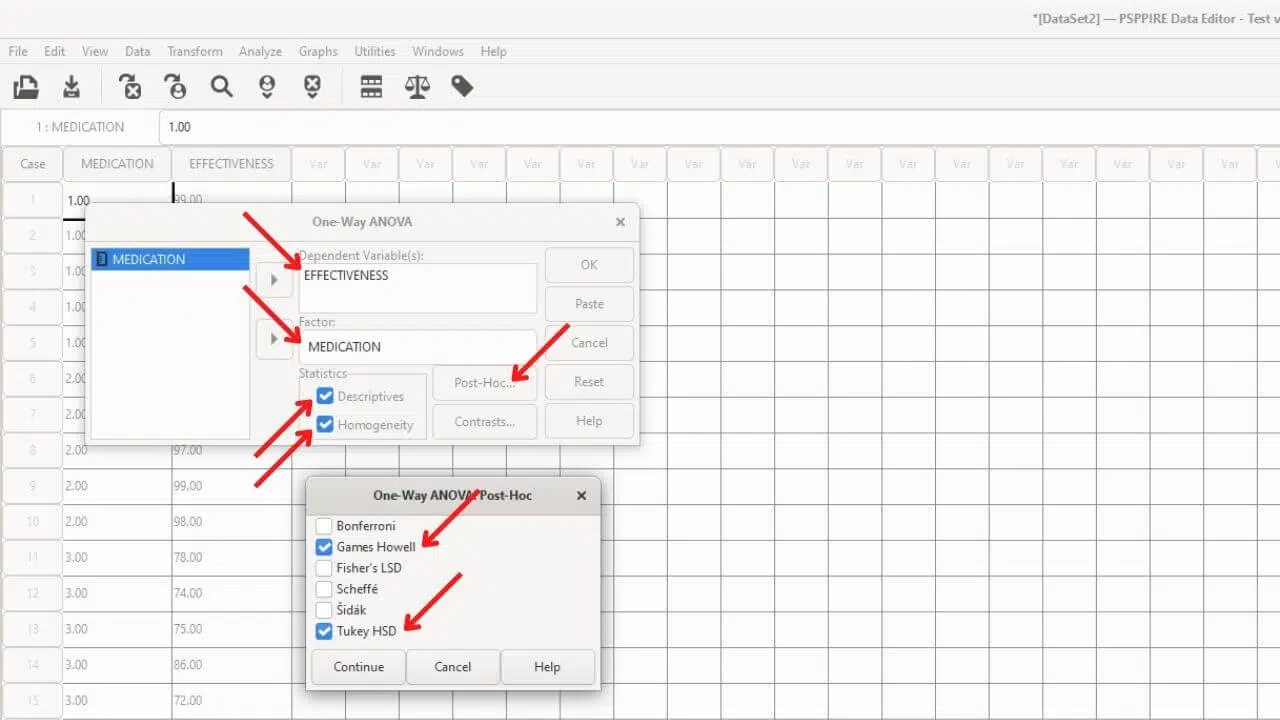
When we have three or more groups to compare, we cannot use the t-test. In these cases, we use the ANOVA test.
In this example, we will compare the effectiveness of three different medications in curing bacterial infections.
Therefore, we will have two columns (medication and effectiveness) since we will compare three groups (medication 1, 2, and 3) concerning a quantitative variable (effectiveness in %).
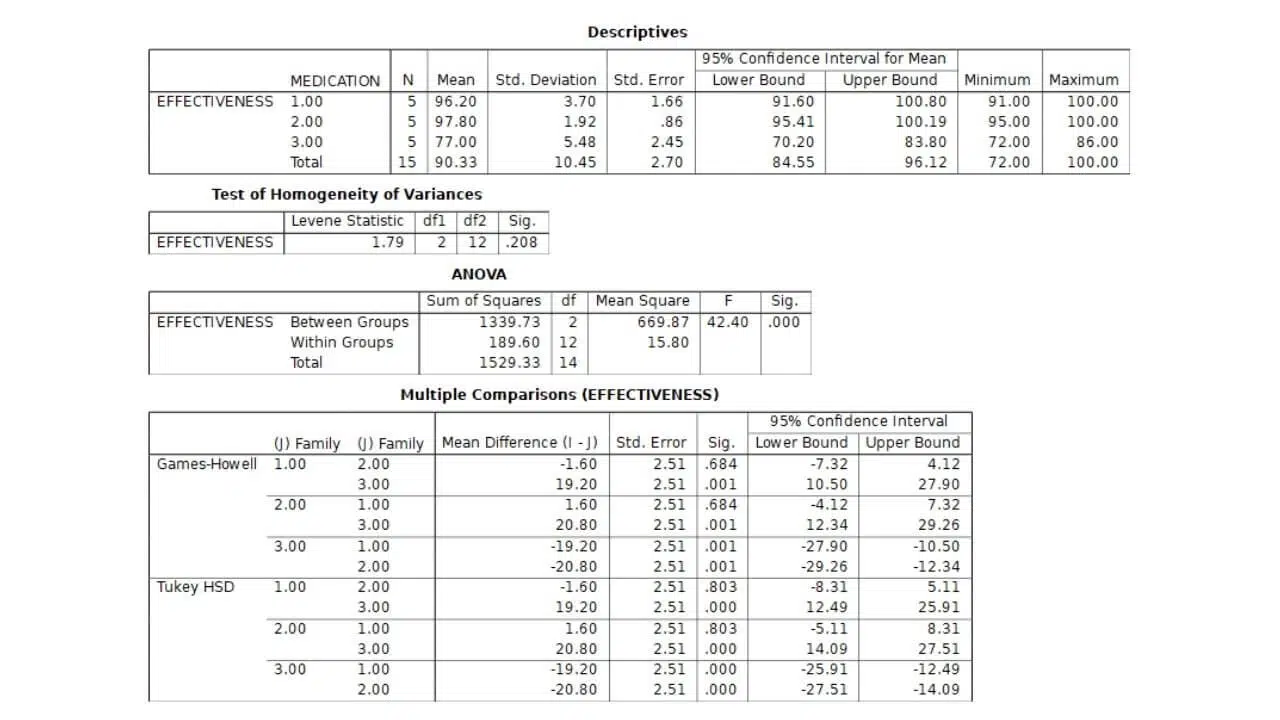
In the results below, note the following information:
(1) Levene’s test indicated that the data have equal variances (homoscedasticity) because the p-value was 0.208, i.e., greater than 0.05.
(2) The ANOVA test showed a p-value less than 0.001; it was statistically significant.
(3) Thus, we conclude that there is a significant difference in mean efficacy between at least one pair of drugs.
We need to check the a posteriori (post hoc) test results to determine which pair or pairs were different.
We use the Tukey HSD results because the residuals showed homoscedasticity. Otherwise, we could use Games-Howell.
Now we can see that drug 3 was different from 1 and 2.
Don’t forget to check the normality of the residuals before starting this analysis — we will discuss this later.
Our complete articles about the ANOVA!
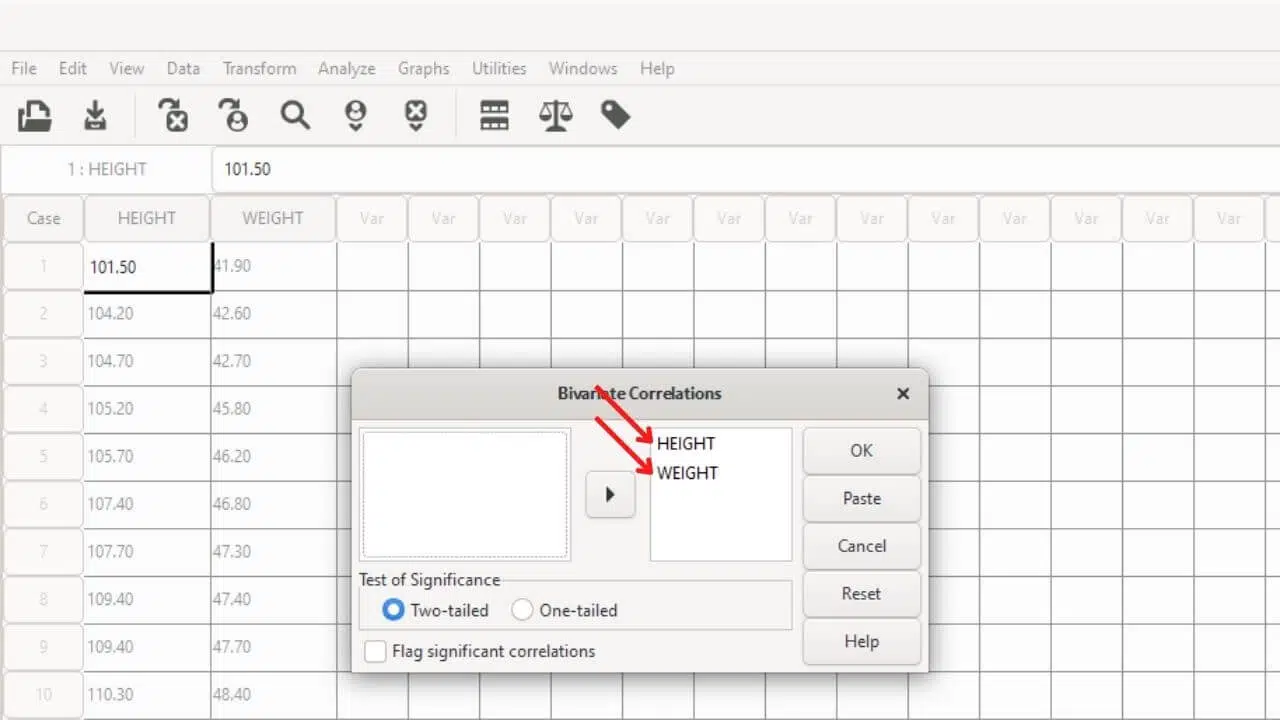
To check if there is a correlation between two quantitative variables, we can use Pearson’s correlation analysis.
In this example, we will check if there is a correlation between the height (cm) and weight (kg) of a group of athletes.
In the results below, note the following information:
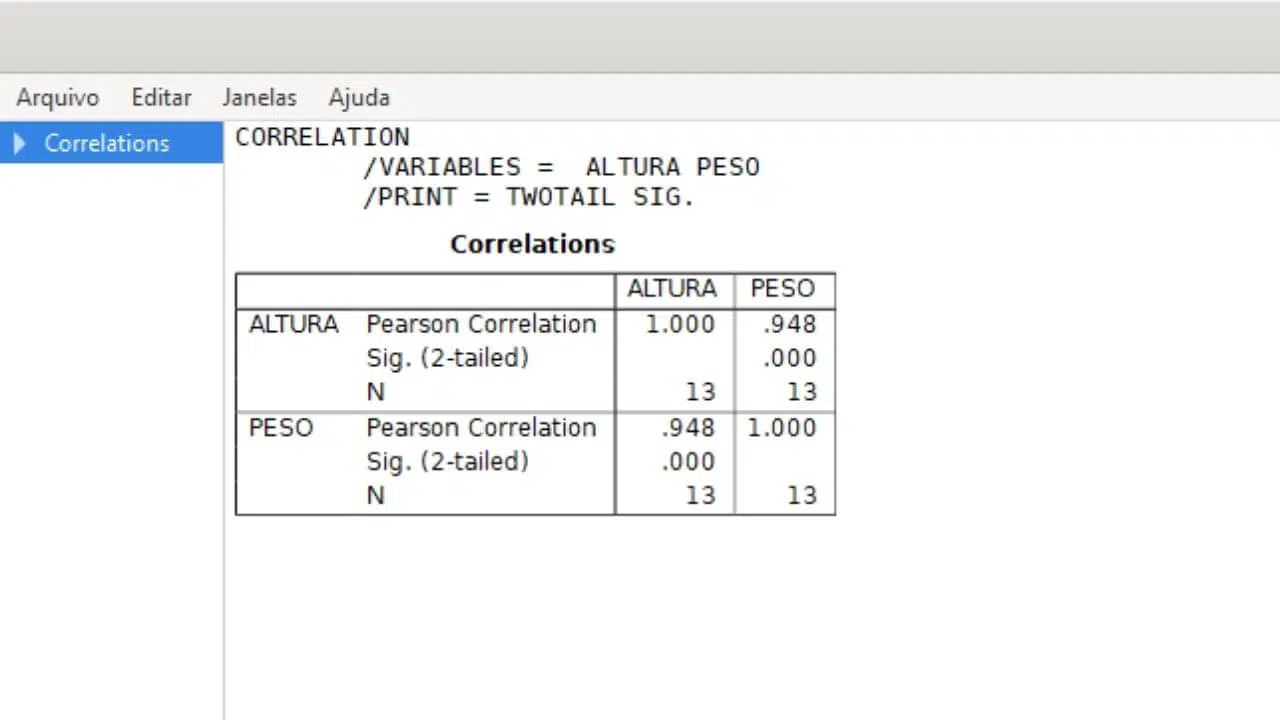
(1) As PSPP creates a correlation matrix, the two boxes represent the same results. First, it tested the correlation between HEIGHT x WEIGHT and then between WEIGHT x HEIGHT, i.e., the same thing changing only the order.
(2) The result was significant, with p < 0.001, indicating a correlation between the two variables.
(3) The correlation coefficient, r, which can range from -1 to +1 and indicates the strength and direction of the correlation, showed a value of +0.95, i.e., there is a strong positive correlation between HEIGHT and WEIGHT.
Don’t forget to check the normality before starting this analysis — we will discuss this later.
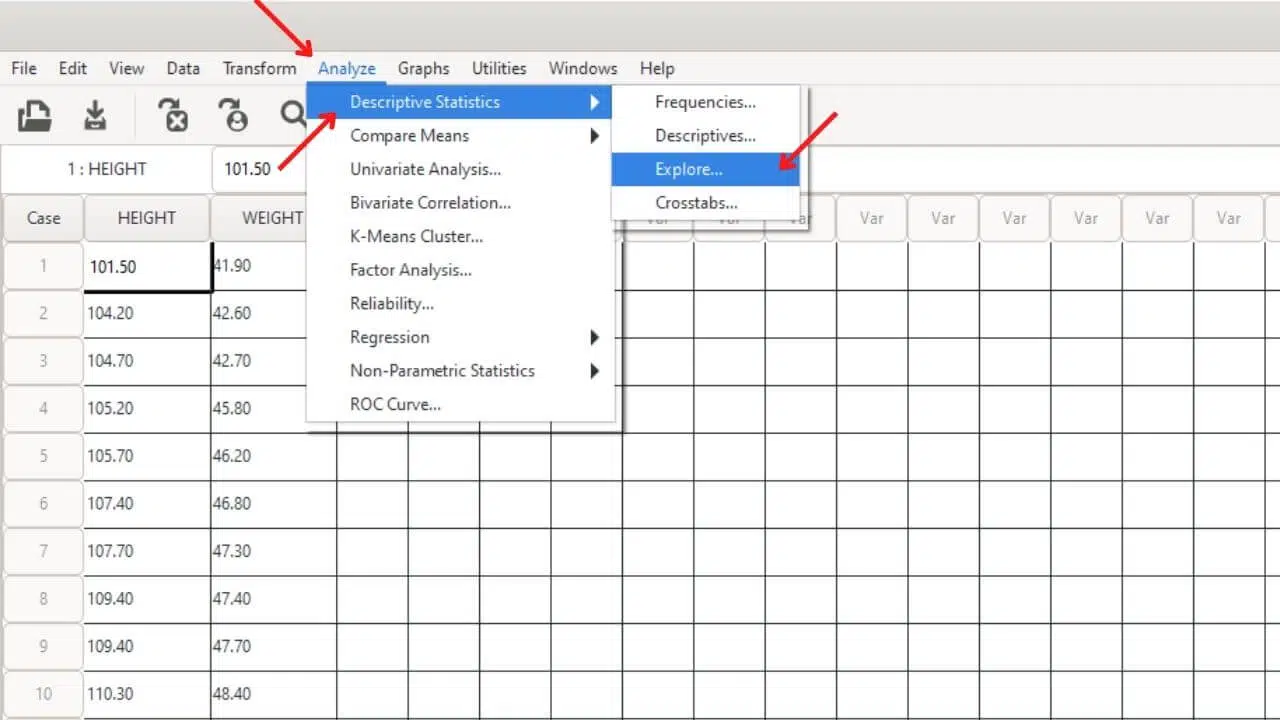
There are several ways to check whether a data set fits the normal distribution.
The ways are visual inspection of graphs, summary measures such as kurtosis and skewness, and inferential tests.
Some critical information about the results:
We can check for normality by analyzing various characteristics of the data.
Besides visual inspection and summary measures, there are inferential tests — the Shapiro-Wilk test has been one of the most indicated.
(1) Shapiro-Wilk inferential normality test = For the data analyzed to fit the normal distribution, it must be above the significance level, p > 0.05.
(2) Skewness and Kurtosis must have values between -1 and +1. In a normal distribution, both measures are zero. However, if their values are between -1 and +1, it is considered that the data satisfactorily follow the normal distribution.
(3) Normal Q-Q Plot = The data, represented by circles, must follow the line on the graph.
(4) Mean, and median must have similar values.
(5) Coefficient of variation needs to be less than 30%.
*Coefficient of variation (CV) = Divide the standard deviation by the mean and multiply the result by 100.
An essential aspect of inferential tests normality assumption verification is that we must accomplish the above procedure from the analysis’s residuals, not the raw data.
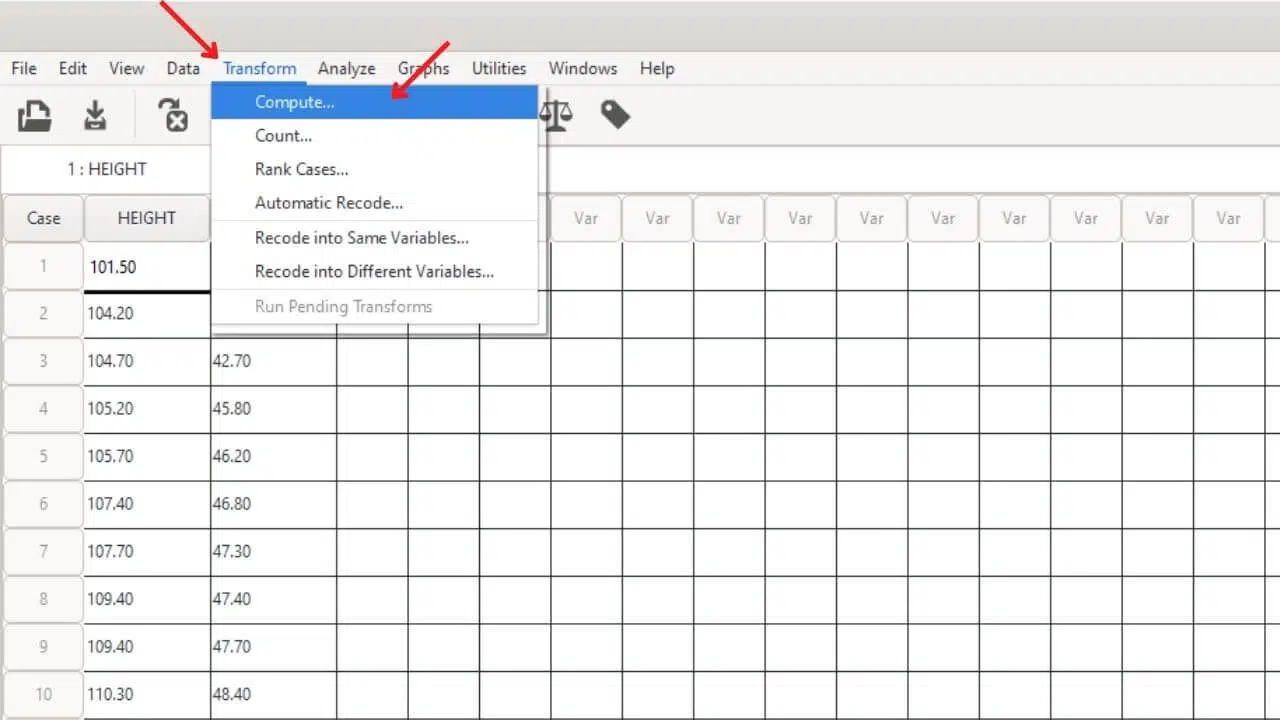
If the normality assumption is violated, you can try a data transformation.
There are several types of transformations, such as logarithmic and square root.
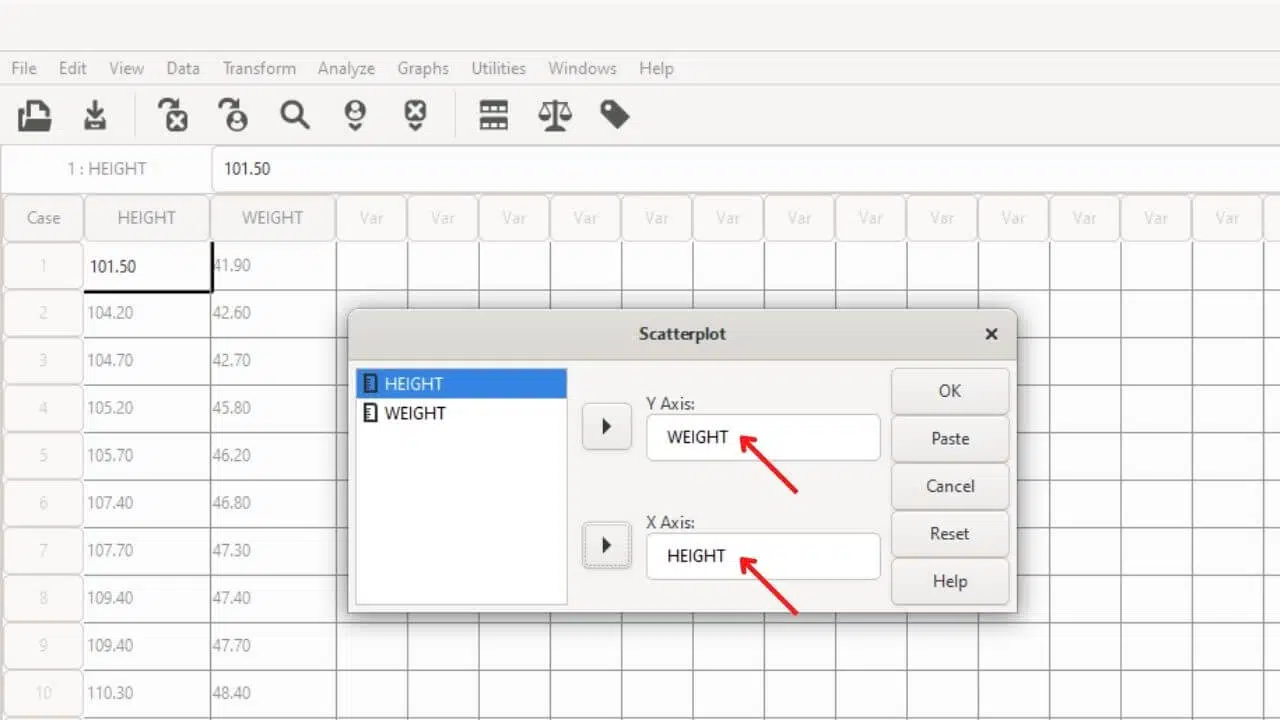
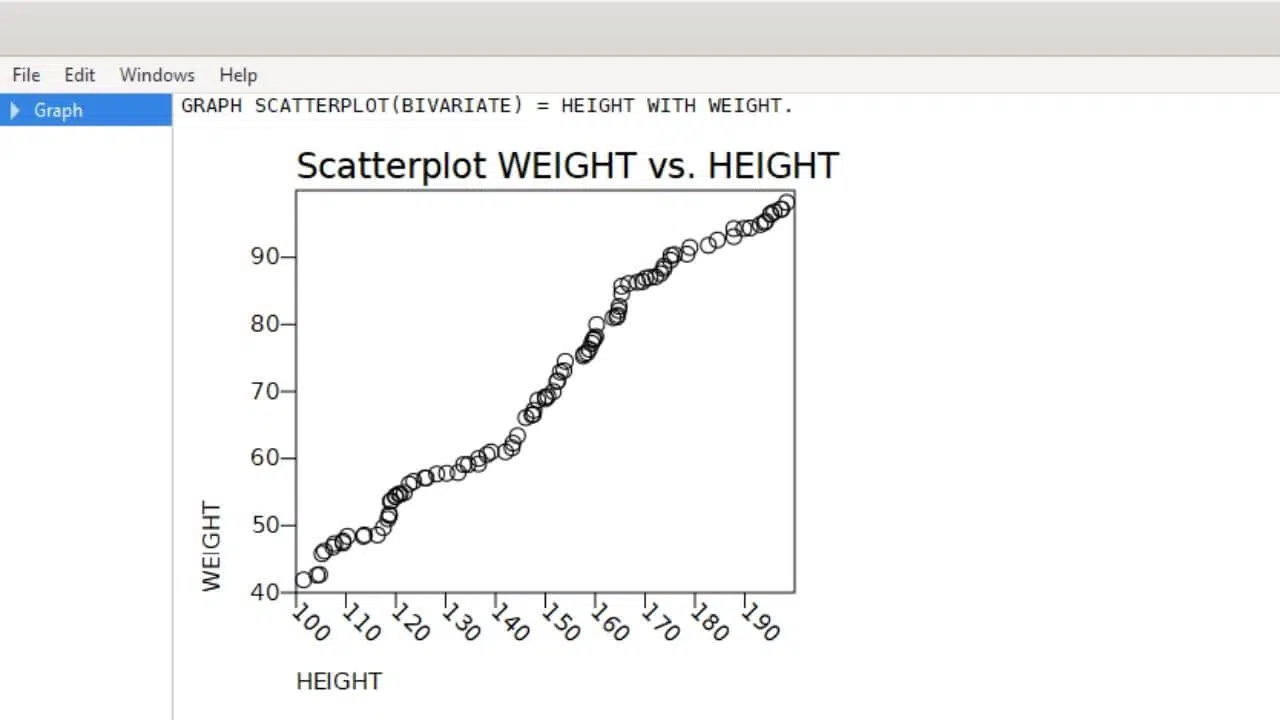
We can make scatterplots, histograms, and bar charts in PSPP.
Although these are the most commonly used graph types, we feel that other options are lacking.
For the scatterplot, we need two quantitative variables.
We have found some minor problems with PSPP, such as the limited graphs possibilities.
Despite this, the program represents a comprehensive package of analyses, including the most commonly used ones. It would satisfy a large part of ordinary users.
These analyses are descriptive analysis, t-tests, one-way ANOVA, linear and logistic regression, association measures, cluster analysis, factor analysis, reliability analysis, non-parametric tests, etc.
In addition, the program is intuitive and has a graphical interface very similar to SPSS, which would facilitate user migration.
These facts, coupled with the fact that it is entirely free, with no hidden expiration periods and no extra packages sold, make it an excellent statistical package for most cases.
Verdict: PSPP is an excellent statistical package for more simple analyses. It still needs to be better to build quality plots.
Q1: What is PSPP? PSPP is a free, open-source alternative to SPSS, offering similar functionality and user interface.
Q2: How does PSPP compare to SPSS? PSPP covers the most common analyses and has a similar user interface but lacks advanced graphical capabilities.
Q3: Is PSPP suitable for advanced data analysis? PSPP is well-suited for more straightforward tasks but may not be ideal for more complex data analysis requiring advanced graphical capabilities.
Q4: Can PSPP perform ANOVA? Yes, PSPP can perform one-way ANOVA for comparing three or more groups.
Q5: Can PSPP create scatterplots? Yes, PSPP can create scatterplots, histograms, and bar charts.
Q6: How can I check data normality in PSPP? PSPP offers visual inspection of graphs, summary measures, and inferential tests for checking data normality.
Q7: Does PSPP offer data transformation options? Yes, PSPP allows for various data transformations, such as logarithmic and square root transformations.
Q8: Can PSPP perform linear and logistic regression? Yes, PSPP supports both linear and logistic regression analyses.
Q9: Is PSPP completely free? Yes, PSPP is free, with no hidden expiration periods or extra packages.
Q10: Where can I download PSPP? PSPP can be downloaded for free from its official website.

Unlock the power of Generalized Linear Models in statistical analysis with our beginner-friendly guide and transform data into insights.

Learn how to report correlation in APA style, mastering the key steps and considerations for clearly communicating research findings.

Explore the essence of ‘What Is the Mode in a Data Set’ and its pivotal role in statistical analysis for insightful data interpretation.

Understand the concept of sampling error, its impacts, and strategies to mitigate it in statistical analysis and data science.

Sample Size T-Test: Improve the reliability of your t-test results with our step-by-step guide on calculating the ideal sample size.

We Have Already Presented A Didactic Explanation Of The P-Value, But Not That Precise. Now Learn An Accurate Definition For The P-Value!