
Why the ‘Normal’ Distribution Isn’t Normal: 4 Surprising Facts
The normal distribution isn’t “normal.” Learn 4 facts: what “normal” really means, the Central Limit Theorem, why bell curves appear, and mean+SD.

The normal distribution isn’t “normal.” Learn 4 facts: what “normal” really means, the Central Limit Theorem, why bell curves appear, and mean+SD.
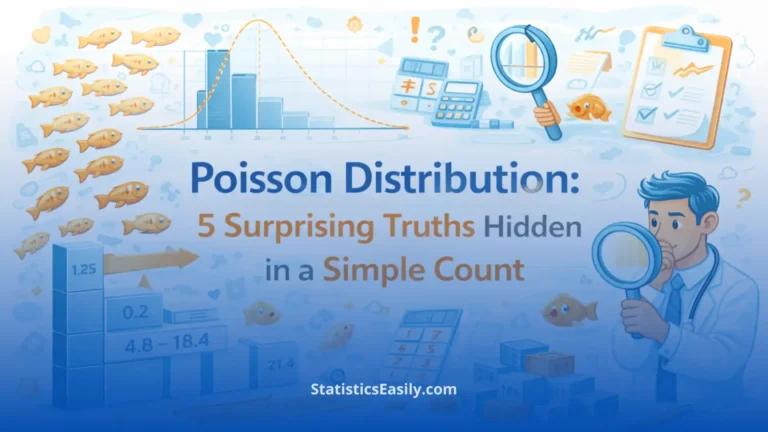
Poisson distribution turns simple counts into insight. Learn 5 truths about confidence intervals from one count, zero events, and why raw counts matter most.

Survival analysis isn’t just for mortality. Learn 4 counter-intuitive truths about censoring, median vs mean survival, and assumptions that can bias results.

Confidence intervals show uncertainty around averages and rates. Learn what 95% confidence really means, why assumptions matter, and the rule of three.
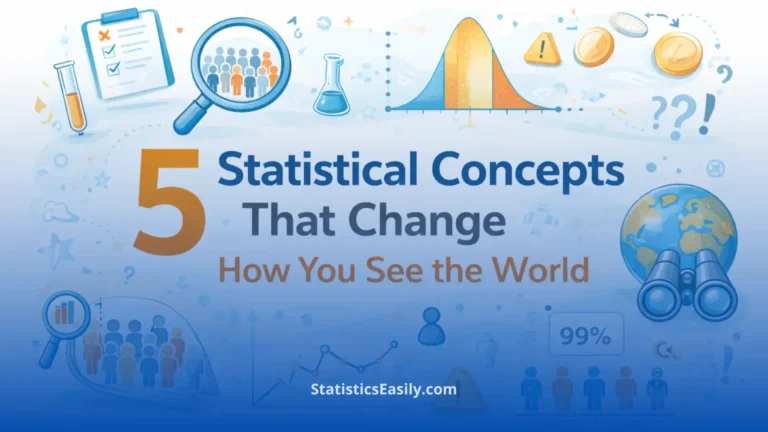
Discover 5 core statistical concepts—sampling error vs bias, models, and the limits of small samples—that reshape how you interpret data every day.
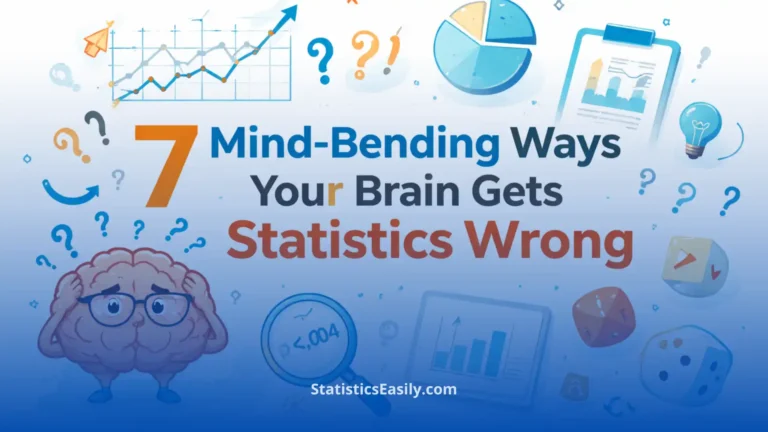
Statistics misconceptions are common. Learn 7 cognitive biases that distort probability, p-values, and small samples—so your decisions are truly data-driven.

Explore the distinctions between incidence vs. prevalence to enhance your understanding of epidemiological studies and public health.

Unlock the essentials of confidence limits in data analysis, empowering your data interpretation skills for precise decision-making.

Master “How do you calculate degrees of freedom” in statistical analysis to enhance data accuracy and insights.

Discover the essence of a correlational study, its significance in research, and how it illuminates the relationships between variables.

Discover the essence of independence, the statistical correlation antonym, and its impact on data analysis through a concise overview.

Explore how the odds ratio provides insights into data relationships, enhancing your statistical analysis. Perfect for researchers.