
Confidence Limits: Understanding Their Role in Data Analysis
You will learn the pivotal role confidence limits play in enhancing the accuracy of statistical conclusions.
Introduction
In statistical analysis, confidence limits are crucial numerical boundaries that frame the estimated range of a parameter with a given level of certainty. These limits anchor our understanding of data variability and empower decision-makers by providing a probabilistic assessment of reliability and precision in their interpretations. This article aims to unfold the concept of confidence limits thoroughly, offering readers a foundation to appreciate their indispensable role in navigating the complexities of data-driven insights and informed decision-making. Through a meticulous exploration of confidence limits, we endeavor to enhance the analytical acumen necessary for navigating the intricate landscape of statistical inference, thereby reinforcing the commitment to uncovering the veracity and profundity within data analysis practices.
Highlights
- Confidence limits delineate the range where a population parameter lies with a certain probability.
- Sample size and variance directly influence the width of confidence limits, impacting statistical precision.
- Differentiating confidence limits from prediction intervals clarifies their unique applications in analysis.
- Advanced tools like R and Python offer robust methods for calculating confidence limits efficiently.
- Interpreting confidence limits correctly is crucial for drawing reliable conclusions in research studies.
Ad Title
Ad description. Lorem ipsum dolor sit amet, consectetur adipiscing elit.
Confidence Limits Theoretical Foundations
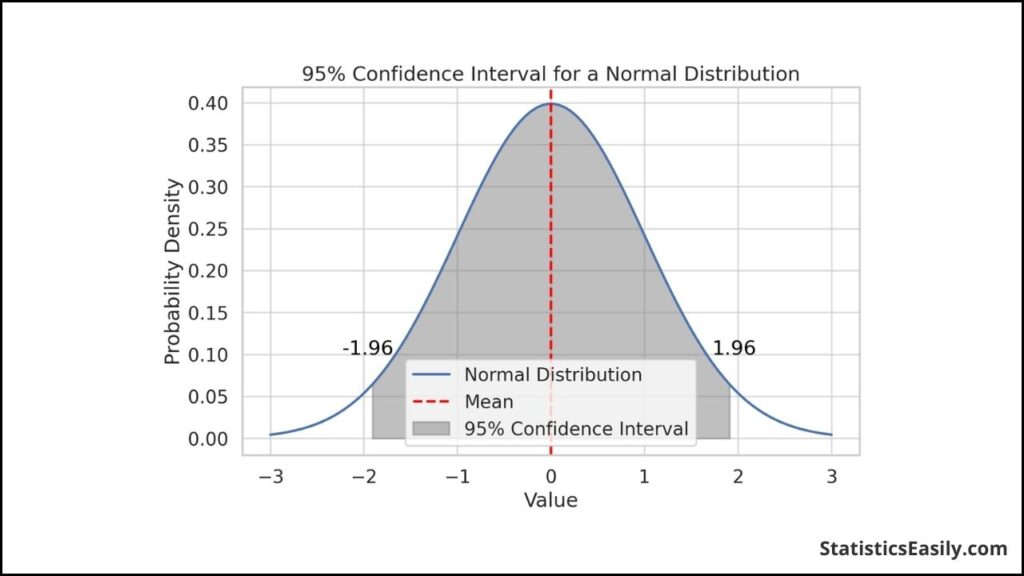
In exploring confidence limits, a fundamental concept resides at the heart of statistical inference: confidence intervals. These intervals represent ranges, estimated from sample data, within which we expect a population parameter (e.g., mean, proportion) to reside with a certain degree of confidence — typically 95% or 99%. The confidence limits — the upper and lower bounds of these intervals — serve as critical demarcations, encapsulating the range of plausible values for the parameter in question.
Delving into the theoretical underpinnings, we encounter foundational concepts such as population parameters and sample statistics. Population parameters depict the true values we aim to estimate through our analysis. At the same time, sample statistics are the estimates derived from our collected data. The bridge between these two realms is constructed via the central limit theorem, which posits that, given a sufficiently large sample size, the sampling distribution of the sample mean will approximate a normal distribution, regardless of the population’s distribution. This theorem underpins the calculation of confidence intervals and, by extension, confidence limits, facilitating their application even in situations where the population distribution is unknown.
Distinguishing confidence limits from prediction intervals is paramount for their correct application. While confidence limits articulate the uncertainty around the estimate of a population parameter, prediction intervals encompass the uncertainty around individual observations. This distinction is crucial, as it highlights the unique application of each: confidence limits for parameter estimation and prediction intervals for forecasting individual outcomes.
We bolster our statistical acumen and sharpen our analytical precision by grounding our understanding in these theoretical foundations. Such clarity in data analysis enables us to navigate complex datasets and extract meaningful insights, advancing our pursuit of truth and contributing to informed decision-making processes.
Calculating Confidence Limits
Calculating confidence limits is pivotal in statistical analysis, providing a quantifiable boundary within which we anticipate the true population parameter to reside based on sample data. This calculation is underpinned by specific distributions — commonly the normal distribution for large samples and the t-distribution for smaller samples or when the population standard deviation is unknown.
Impact of Sample Size, Variance, and Confidence Level
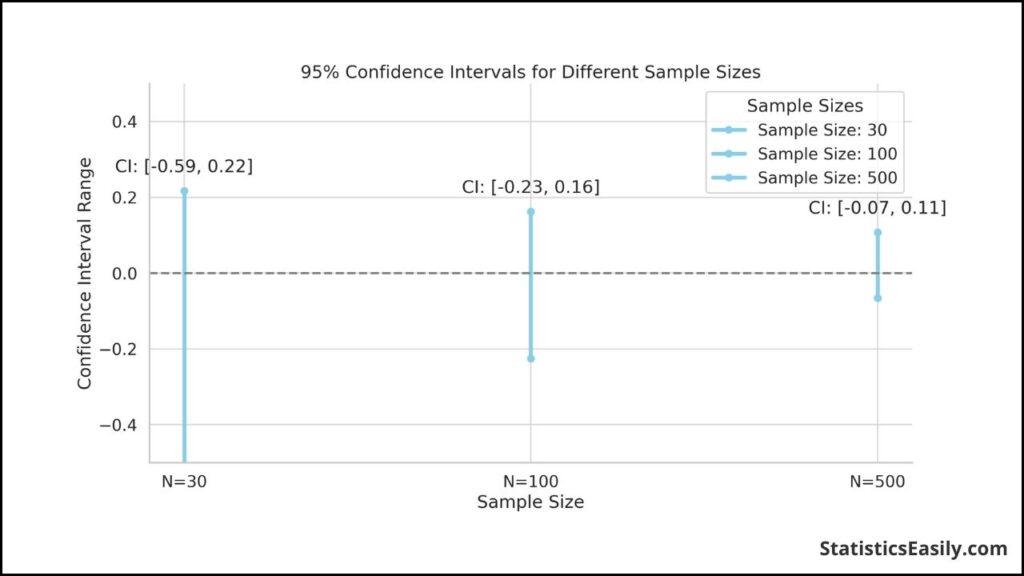
The sample size, variance, and the chosen confidence level significantly influence the precision of confidence limits. A larger sample size decreases the standard error, leading to narrower confidence limits and, thus, a more precise estimate of the population parameter. Conversely, higher variance within the sample data widens the confidence limits, reflecting increased uncertainty in the estimate. The confidence level, typically set at 95% or 99%, also plays a crucial role; a higher confidence level widens the confidence limits, accounting for greater uncertainty to ensure the interval encompasses the true parameter with the desired confidence level.
Software Tools for Calculation
In contemporary data analysis, software tools and programming languages such as R and Python are indispensable for efficiently calculating confidence limits. These tools offer built-in functions that automate complex computations, facilitating their application across diverse data sets and research scenarios.
- In R, functions like ‘t.test’ for means or ‘prop.test’ for proportions can be utilized, where the confidence limits are part of the output.
- Python, with libraries such as SciPy and StatsModels, provides functions like ‘scipy.stats.t.interval’ for calculating confidence limits based on the t-distribution, catering to different data analysis needs.
Employing these tools not only streamlines the calculation process but also enhances the accessibility of statistical analysis, allowing researchers and analysts to focus more on interpreting and applying results.
Interpreting Confidence Limits
Interpreting confidence limits within research and data analysis necessitates a nuanced understanding to avoid common misconceptions leading to misinterpretation of results. These limits, demarcating the range within which we estimate a population parameter to lie, provide a measure of statistical certainty but are often misunderstood.
A prevalent misconception is the belief that a confidence interval containing the value of a null hypothesis parameter (like zero in a test of means) directly implies the null hypothesis cannot be rejected. This interpretation overlooks that confidence intervals are constructed based on sample data and subject to sample variability. They offer a range of plausible values for the parameter, not a definitive test of the hypothesis.
Moreover, there’s a common pitfall in assuming that the confidence interval represents the probability of the true parameter lying within the interval.
The correct interpretation is that if we were to repeat the study numerous times, 95% (for a 95% confidence level) of the calculated confidence intervals from those studies would contain the true parameter.

Real-World Example: Medical Research
In a medical study assessing the effectiveness of a new drug, the confidence limits might suggest that the drug leads to an average improvement in patient recovery time between 2 to 5 days, at a 95% confidence level. Misinterpretation arises if one concludes that there’s a 95% chance the true average improvement lies within this interval. The accurate interpretation is that we are 95% confident this interval has captured the true mean improvement; this distinction underscores the inference’s reliability, not a probability statement about the parameter.
Real-World Example: Environmental Science
Consider an environmental study estimating the decrease in pollutant levels after implementing a clean-air policy, with confidence limits indicating a reduction of 10 to 15 micrograms per cubic meter. A common pitfall is assuming these limits offer a probability range for pollutant reduction. Instead, they should be understood as the range in which we are confident, based on our sample, that the true average reduction across the population falls should the study be replicated under identical conditions.
Confidence Limits in Various Disciplines
The application of confidence limits transcends the realm of pure statistics, embedding itself across various disciplines where data-driven decisions are pivotal. These disciplines leverage confidence limits to quantify uncertainty, guide research methodologies, and underpin policy decisions.
Medicine
In the medical field, confidence limits are instrumental in evaluating the efficacy and safety of new treatments. For instance, a clinical trial investigating a new medication’s effectiveness might report a reduction in symptom severity with these limits indicating the range of this reduction. This range is crucial for healthcare professionals to assess the treatment’s potential benefits and risks, informing clinical guidelines and patient care strategies.
Environmental Science
Environmental scientists rely on confidence limits to evaluate the impact of interventions on pollution levels, biodiversity, and climate change models. A study on the effects of a pollutant reduction policy might use these limits to present the estimated change in pollutant levels, offering insights into the policy’s effectiveness and guiding future environmental regulations.
Economics
In economics, confidence limits are central in forecasting economic indicators such as GDP growth, inflation rates, and unemployment. For example, an economic forecast might predict a GDP growth rate with these limits, providing policymakers and businesses with a range within which the actual growth rate is expected to fall, thereby aiding in fiscal planning and policy formulation.
Case Study: Public Health Policy
A notable case where confidence limits were pivotal involved a public health study assessing the impact of a smoking ban on heart attack rates. The study reported a significant reduction in heart attack admissions post-ban, with these limits offering a precise range for this reduction. These findings influenced public health policies, leading to the widespread adoption of smoking bans in public areas to improve community health outcomes.
Case Study: Environmental Conservation
Another illustrative example comes from conservation biology, where researchers used confidence limits to estimate the population size of an endangered species within a protected area. These limits provided a range for the population size estimate, guiding conservation efforts and resource allocation to ensure the species’ survival.
Advanced Topics and Controversies
Non-Parametric Confidence Intervals
Non-parametric confidence intervals offer a solution when the data does not adhere to standard parametric tests’ assumptions, such as normality. Techniques like bootstrapping, which involves resampling the data with replacement, provide a way to estimate confidence intervals without relying on specific distributional assumptions. This flexibility makes non-parametric methods invaluable in handling data with unknown or non-normal distributions, albeit often at the cost of increased computational complexity.
Bayesian Confidence Intervals
Bayesian confidence or credible intervals represent a fundamental departure from the frequentist perspective, incorporating prior knowledge or beliefs into the analysis. Given the data, this approach yields intervals that can be interpreted as the probability of the parameter lying within, which contrasts with the frequentist interpretation that does not assign probabilities to parameters. Despite their intuitive appeal, Bayesian methods are subject to scrutiny regarding the choice of prior, which can significantly influence the results, especially in cases with limited data.
Frequentist vs. Bayesian Interpretations
The debate between frequentist and Bayesian methodologies centers on foundational philosophical differences in interpreting probability. Frequentists view probability as the long-run frequency of events, leading to confidence intervals that reflect the procedure’s properties over many repetitions. Conversely, Bayesians interpret probability as a degree of belief, allowing for more direct probabilistic statements about parameters. This debate underscores the divergent approaches to statistical inference and the implications for decision-making and scientific conclusions.
Limitations and Criticisms of Traditional Confidence Limit Interpretations
Traditional interpretations of confidence limits, rooted in the frequentist paradigm, face criticism for their sometimes counterintuitive nature and potential for misinterpretation. For instance, the fixed confidence level (e.g., 95%) does not directly convey the probability that the parameter lies within the interval for a specific study. Furthermore, the reliance on large-sample approximations in some methods can be problematic for small-sample studies, leading to misleading conclusions.
Ad Title
Ad description. Lorem ipsum dolor sit amet, consectetur adipiscing elit.
Conclusion
This article has traversed the multifaceted landscape of confidence limits, elucidating their foundational principles, computational methodologies, interpretive nuances, and cross-disciplinary applications. By dissecting theoretical underpinnings, we’ve illuminated how these limits serve as pivotal tools in statistical analysis, offering a probabilistic lens through which the reliability and precision of data-driven insights can be assessed. The exploration of calculation techniques, enhanced by modern software tools like R and Python, underscores the evolution of statistical practices toward greater efficiency and accessibility. Delving into interpretation challenges, we’ve navigated common misconceptions, advocating for a nuanced comprehension essential for robust scientific inquiry. The discourse extended into diverse fields, showcasing confidence limits as indispensable in shaping research, policy-making, and practical decision-making across various domains.
Recommended Articles
Explore more on statistical methodologies and enhance your data analysis prowess by delving into other insightful articles on our blog.
- Confidence Interval Calculator: Your Tool for Reliable Statistical Analysis
- Interpreting Confidence Intervals: A Comprehensive Guide
- Confidence limits and the limits of confidence (External link)
- Statistics vs Parameters: A Comprehensive FAQ Guide
- How to Interpret Confidence Intervals?
- Exploring Standard Deviation (Story)
Frequently Asked Questions (FAQs)
Q1: What is meant by 95% confidence limits? 95% confidence limits define a range constructed from sample data such that, if the study were repeated numerous times, we would expect 95% of those confidence intervals to contain the true population parameter (like a mean or proportion). This highlights the method’s reliability over many repetitions rather than the certainty of a single interval containing the parameter.
Q2: How do you interpret confidence limits? Confidence limits are where we expect the true population parameter to reside. They reflect the uncertainty associated with the estimate, where wider limits suggest greater uncertainty.
Q3: What is a 90% confidence limit? A 90% confidence limit establishes a range that, when the study is replicated under the same conditions multiple times, is expected to encompass the true population parameter in 90% of those studies. It reflects a balance between precision and certainty, with a narrower interval compared to a 95% confidence limit and a higher risk of the interval not containing the parameter in any study.
Q4: What is the 95% confidence limit of the deviations? The 95% confidence limit of the deviations indicates the range within which we can expect 95% of the deviations from the mean (in a dataset) to lie, reflecting the variability of the data.
Q5: How do software tools like R and Python facilitate the calculation of confidence limits? Software tools like R and Python provide built-in functions and libraries, such as ‘t.test’ in R and ‘scipy.stats’ in Python, to automate complex computations to determine confidence limits, enhancing efficiency and accuracy.
Q6: How do sample size and variance affect the width of confidence limits? Larger sample sizes and lower variance lead to narrower confidence limits, indicating more precise population parameter estimates. Smaller samples or higher variance widen the limits, reflecting greater uncertainty.
Q7: What role do non-parametric methods play in calculating confidence limits? Non-parametric methods, like bootstrapping, estimate confidence limits without relying on normal distribution assumptions, making them useful for data that doesn’t fit traditional parametric criteria, albeit often with increased computational demand.
Q8: How do Bayesian confidence intervals differ from traditional frequentist confidence intervals? Bayesian confidence intervals, or credible intervals, incorporate prior knowledge and are interpretable as the probability of the parameter lying within the interval, unlike frequentist intervals, which do not assign probabilities to parameters.
Q9: What is the impact of misinterpreting confidence limits in research? Misinterpreting confidence limits can lead to incorrect conclusions, such as overestimating the certainty of findings, potentially compromising the validity of research and subsequent decisions based on the analysis.
Q10: In what ways are confidence limits applied across different disciplines? Confidence limits are used in various fields, from assessing new medical treatments and environmental policies to economic forecasting, where they quantify uncertainty and inform decision-making, policy formulation, and conservation strategies.