Statistics Without Math? Is It Possible?
Yes, it is possible to understand and apply statistics without complex math. By focusing on basic logical concepts, real-world observations, and simple graphs, students and researchers can grasp statistical principles and effectively analyze data without becoming overwhelmed by mathematical complexities.
Do you need statistics and data analysis for your scientific research but need help understanding and applying the concepts due to mathematical complexities? Don’t worry; you’re not alone. Most students and researchers in fields unrelated to exact sciences also experience this issue. Continue reading to discover how and why it’s possible to understand and apply statistics without relying on complex mathematical concepts.
The Problem
Many students and researchers across various fields face significant challenges with statistics.
This issue is particularly concerning since data analysis is crucial to all scientific research.
Fortunately, it is possible to grasp the basics of statistics and apply data analysis effectively without becoming overwhelmed by mathematical concepts.
The Solution
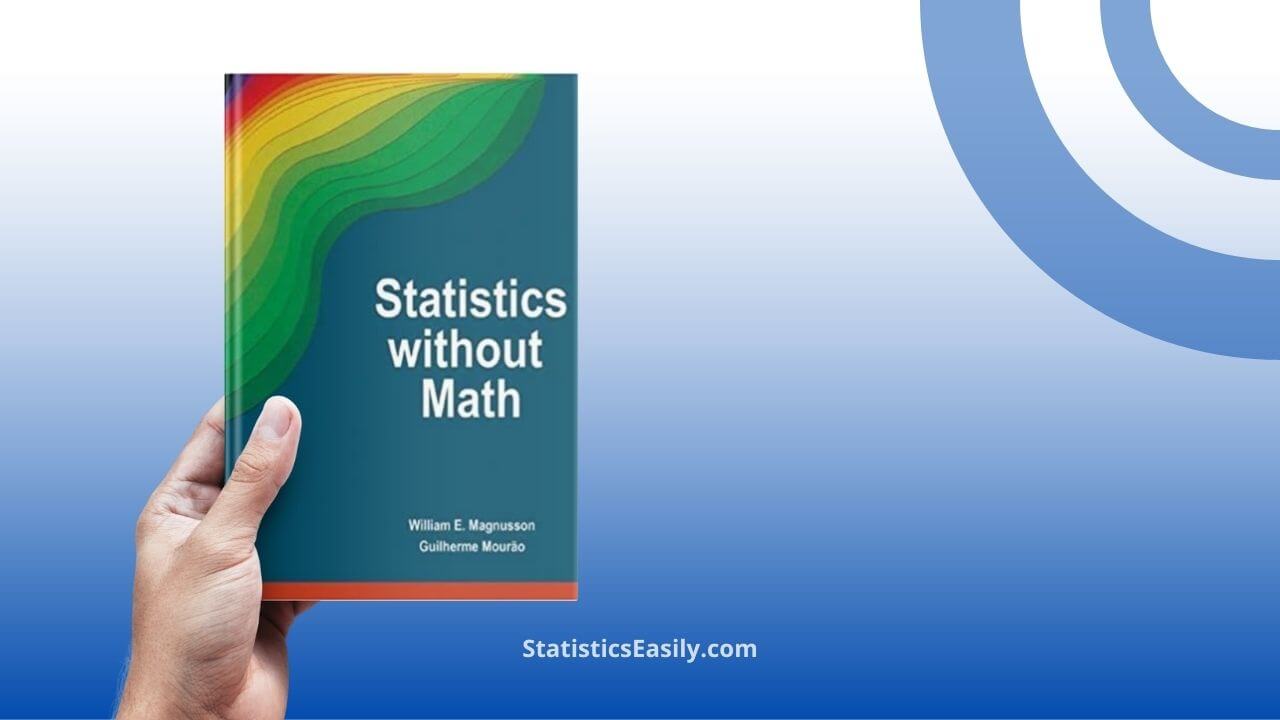
In 2004, William Magnusson and Guilherme Mourão published the book Statistics Without Math.
“Statistics without Math is not your ordinary statistics book, nor is it designed to serve as a substitute for conventional statistical texts. Too much mathematical detail diverts attention away from basic logical concepts, resulting in errors in sampling design, data analysis, and comprehension of the scientific literature. Hence, this book starts with real-world observations and explains how statistics may be used as a practical tool to answer questions about them and to communicate these results. Finally, the book targets intermediate-level statistics (given short shrift in most books and courses) and teaches concepts with a minimum of mathematical detail instead of using simple graphs and, where necessary, analogy. This approach, class-tested for many years by the authors, has revolutionized students’ ability to understand statistics.“
Some essential facts and insights from the book include:
Key Takeaways
Data are only helpful if they provide information.
Statistical questions should reflect scientific questions.
The world doesn’t need another statistics book.
Equations and statistics merely reflect what graphs show.
Research projects have no implicit or apparent questions.
A null hypothesis asserts what the world would be like if our beliefs were wrong.
Interpreting graphs is often more important than interpreting statistics.
Finding the right question is often more critical than finding the correct answer.
If equations intimidate you, turn to graphs for the same information.
Contingency table analyses (e.g., chi-square) are rarely appropriate for statistical questions.
Moving away from simple scatter plots can unnecessarily complicate the world.
Designing a sample involves collecting data likely to inform good decisions.
A (standard) structure should only be believed if it can be visualized in a simple graph.
Measuring everything and letting “the data speak for itself” is inefficient for discovering information.
Researchers must use logic to decide which variables to include in their analysis.
Mistakenly rejecting the null hypothesis and concluding a phenomenon exists when it doesn’t is called a type I error.
Biologists often prioritize averages, but differences in variability can be more critical.
Construct a flow chart representing the system under study before choosing the analysis.
Testing for differences between means requires assuming approximately equal variability within categories.
Researchers may graph transformed data, but the model’s fit can only be assessed with untransformed data.
Straight lines on graphs minimize the mean distance from the line to the points.
Statistical analyses reduce complex problems to two-dimensional issues presentable in simple scatter plots.
Failing to reject the null hypothesis when false is a type II error, with a probability known as “1−β.”
Paper readers may suspect pseudoreplication and meaningless statistical inferences when encountering a contingency table.
A good rule of thumb for determining replicates is to divide them by ten and limit the model to no more than this number of factors.
Many reported probabilities are pseudoprobabilities, indicating adherence to scientific culture rather than providing objective information about the real world.
The biggest mistake in sample design stems from neglecting basic logical concepts, which students could have absorbed if statistical mathematics hadn’t diverted their attention.
While mathematical treatises on statistics are essential, there may be better ways for students to gain practical knowledge for using statistics to interpret data.
Concluding Remarks
To conduct statistical analysis effectively, follow these fundamental steps:
1. Understand the basic concepts of statistics.
2. Familiarize yourself with the main summary measures, such as arithmetic mean and standard deviation (descriptive statistics).
3. Learn the primary graphs and when and how to use them.
4. Know how to select the appropriate statistical analysis for each occasion and learn how to apply all analysis steps correctly (inferential statistics).
Accomplish all this with statistics without math!