
Mastering One-Way ANOVA: A Comprehensive Guide for Beginners
You will learn the essential steps for conducting a one way ANOVA analysis to compare group means.
Highlights
- One-way ANOVA compares the means of 3 or more groups to determine significant differences.
- Check normality and homogeneity of variances before performing one-way ANOVA.
- Shapiro-Wilk and Kolmogorov-Smirnov tests help verify the normality of residuals (errors).
- Levene’s and Bartlett’s tests help confirm the homogeneity of variances.
- In case of significant results, use appropriate post hoc tests such as Tukey’s HSD, Bonferroni, or Scheffe’s test.
One-way ANOVA is a statistical tool used to test the differences among the means of three or more independent groups. It helps determine whether there is a significant difference between the means of the groups or if the differences are due to random variation (chance).
The one-way ANOVA is called “one-way” because it considers only one independent variable (factor) with multiple levels (groups), and it examines the impact of this factor on a single continuous dependent variable.
The test compares the variability within each group to the variability between the groups. For example, suppose the between-group variability is significantly larger than the within-group variability. In that case, there might be a difference in the means of the compared groups.
Variables Required for One Way ANOVA
To perform a one-way ANOVA, you will need two types of variables: a qualitative independent variable with three or more groups and a continuous quantitative dependent variable.
Qualitative independent variable (factor)
Represents distinct categories or levels you wish to compare. These categories may be different treatments, interventions, or other groupings within your study.
Continuous quantitative dependent variable
Represents the outcome or response you will measure and compare across the different groups. This variable must be continuous, meaning it can assume on any value within a given range. It must be measured on an interval or ratio scale to meet the assumptions of one-way ANOVA.
By analyzing the relationship between these two variables, you can determine if the differences in the dependent variable’s means across the groups are statistically significant.
Assumptions of One Way ANOVA
One-way ANOVA relies on certain assumptions that must be met for the test to produce valid results. These assumptions are:
Independence of observations
The observations within and between the groups must be independent of each other. This means the data sampling should be random and not influenced by external factors or relationships between the subjects.
Normality
The distribution of the residuals (errors) should be approximately normally distributed. This assumption can be checked using various methods, such as histograms, Q-Q plots, or statistical tests like the Shapiro-Wilk or Kolmogorov-Smirnov test.
Homogeneity of variances
The variances of the residuals (errors) should be roughly equal across all levels of the independent variable. This is also known as the assumption of homoscedasticity. You can use Levene’s or Bartlett’s tests to verify variances’ homogeneity.
The one-way ANOVA results might not be reliable if these assumptions are violated.
In such cases, it is necessary to either transform the data to meet the assumptions or consider using nonparametric alternatives like the Kruskal-Wallis test, which does not require the same assumptions as the one-way ANOVA.
Alternatively, you can use corrections like Welch’s ANOVA, which is more robust to violations of the homogeneity of variances assumption.
Example Data
Suppose we want to compare the effects of three different teaching methods on students’ test scores. We have three groups of students, each taught by a different method:
- Group 1: Traditional classroom teaching (lectures and textbooks)
- Group 2: Online learning (video lectures and online resources)
- Group 3: Blended learning (a mix of traditional and online learning)
We will collect test scores from 10 students in each group. Here is the sample data:
| Teaching Method | Score |
|---|---|
| Method A | 75.2 |
| Method A | 80.5 |
| Method A | 82.4 |
| Method A | 76.1 |
| Method A | 84.3 |
| Method A | 88.6 |
| Method A | 90.8 |
| Method A | 70.7 |
| Method A | 85.9 |
| Method A | 89.4 |
| Method B | 78.6 |
| Method B | 81.3 |
| Method B | 74.7 |
| Method B | 87.2 |
| Method B | 83.5 |
| Method B | 80.9 |
| Method B | 88.4 |
| Method B | 85.0 |
| Method B | 86.1 |
| Method B | 92.8 |
| Method C | 90.1 |
| Method C | 94.2 |
| Method C | 92.6 |
| Method C | 85.8 |
| Method C | 89.1 |
| Method C | 91.3 |
| Method C | 88.7 |
| Method C | 84.5 |
| Method C | 95.4 |
| Method C | 86.3 |

🛑 Stop Struggling with Data Analysis
Find Out How Our eBook Can Turn You into an Expert Overnight!
Step-by-step One Way ANOVA
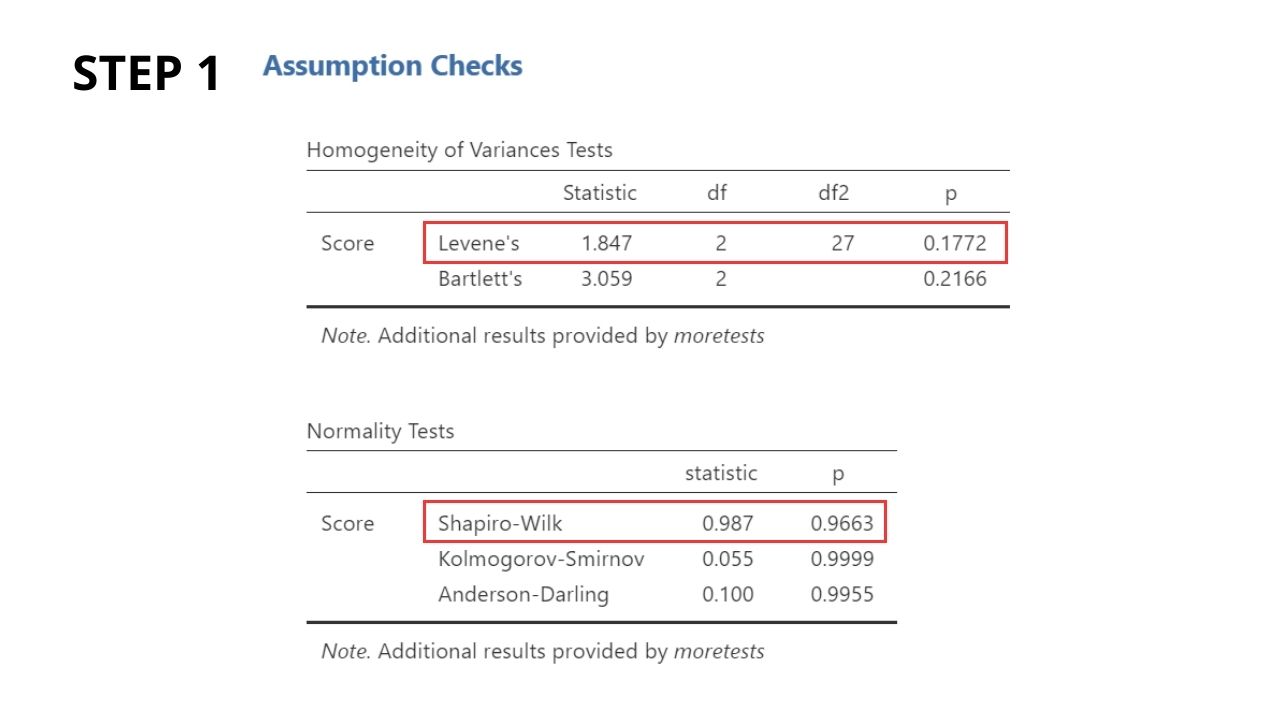
Step 1: Conduct statistical tests to check the assumptions, such as the Shapiro-Wilk or Kolmogorov-Smirnov tests for normality and Levene’s or Bartlett’s tests for homogeneity of variances.
If the p-value for the normality test is less than a predetermined significance level (e.g., 0.05), it indicates that the residuals (errors) do not follow a normal distribution, thus violating the normality assumption.
Report the p-values obtained from these tests to confirm if the assumptions are met or violated. If the assumptions are not met, consider data transformations or alternative statistical methods, such as nonparametric tests.
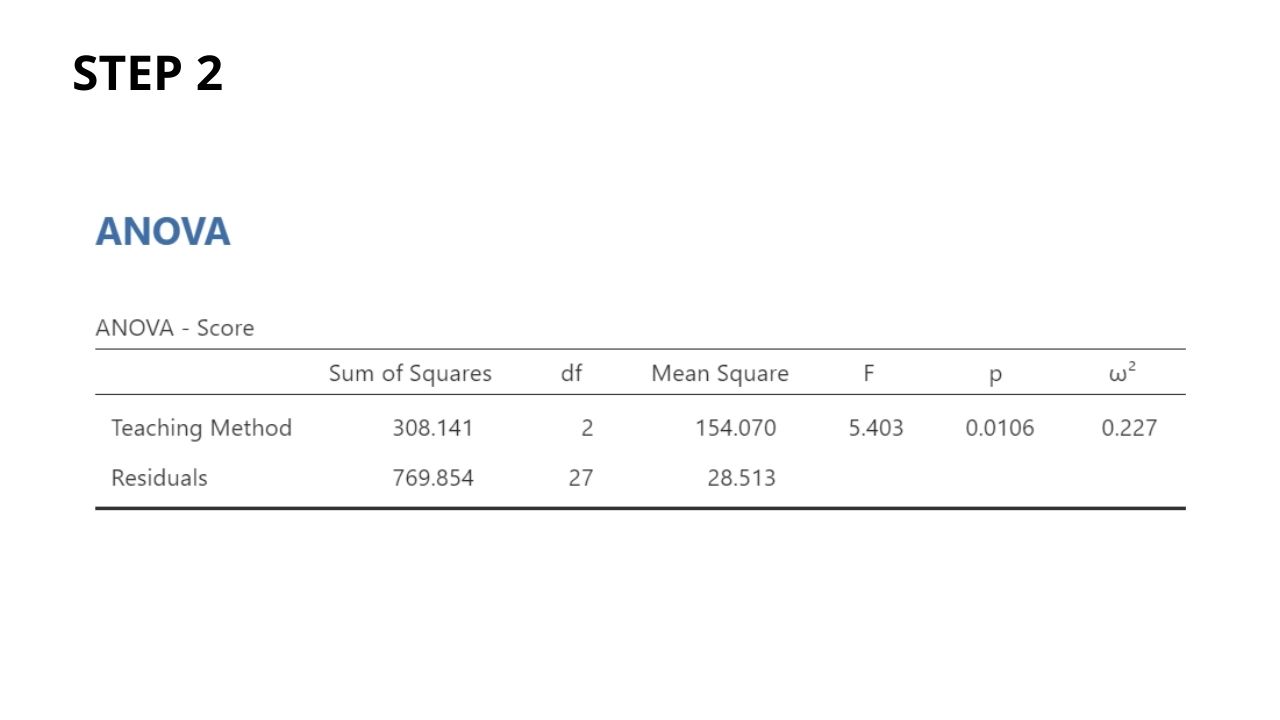
Step 2: Perform the one-way ANOVA to compare the means of the three groups.
Report the p-value from the F-test to determine if there is a significant difference among the group means. If the p-value is less than the predetermined significance level (e.g., 0.05), conclude that there is a significant difference among the groups.
Calculate and report the effect size measures, such as eta-squared (η²) or omega-squared (ω²), to estimate the magnitude of the differences among the group means.
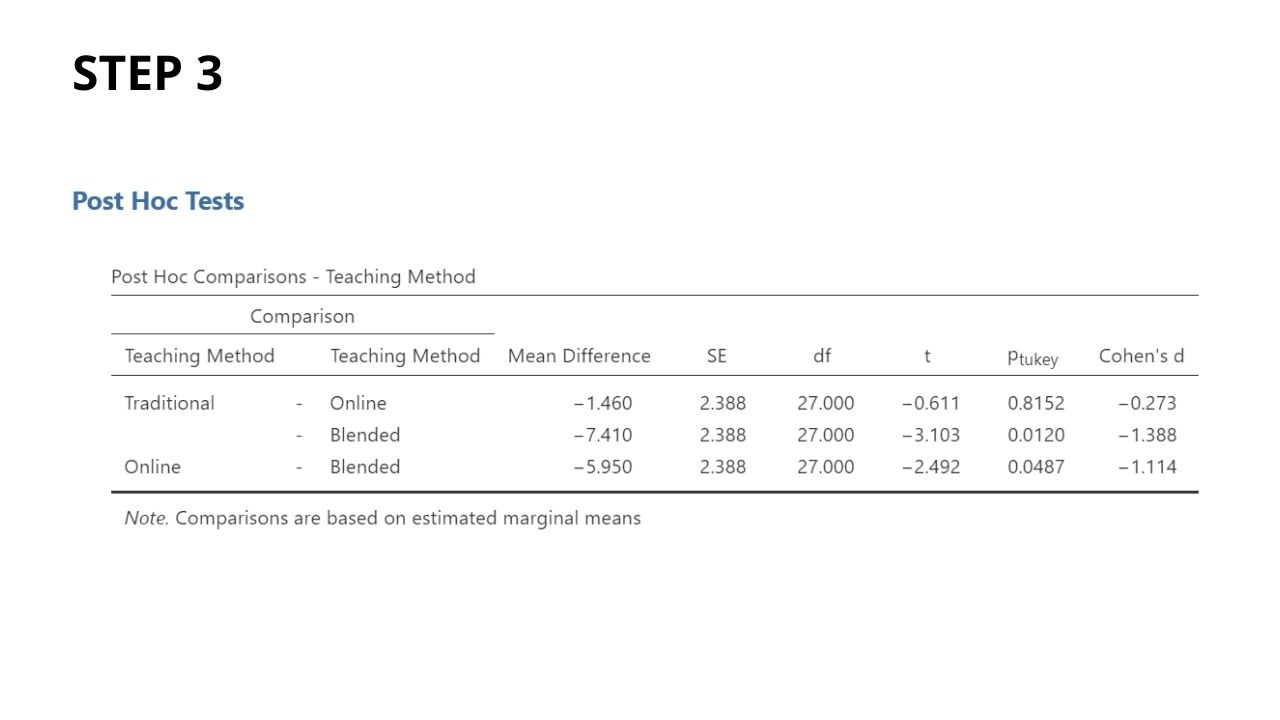
Step 3: If the one-way ANOVA results are significant, perform post hoc tests to identify the specific pairs of groups with significant differences in their means.
Choose an appropriate post hoc test based on the data and assumptions (e.g., Tukey’s HSD, Bonferroni, or Scheffe’s test).
Finally, report the p-values and effect sizes (e.g., Cohen’s d) for the comparisons made in the post hoc tests.
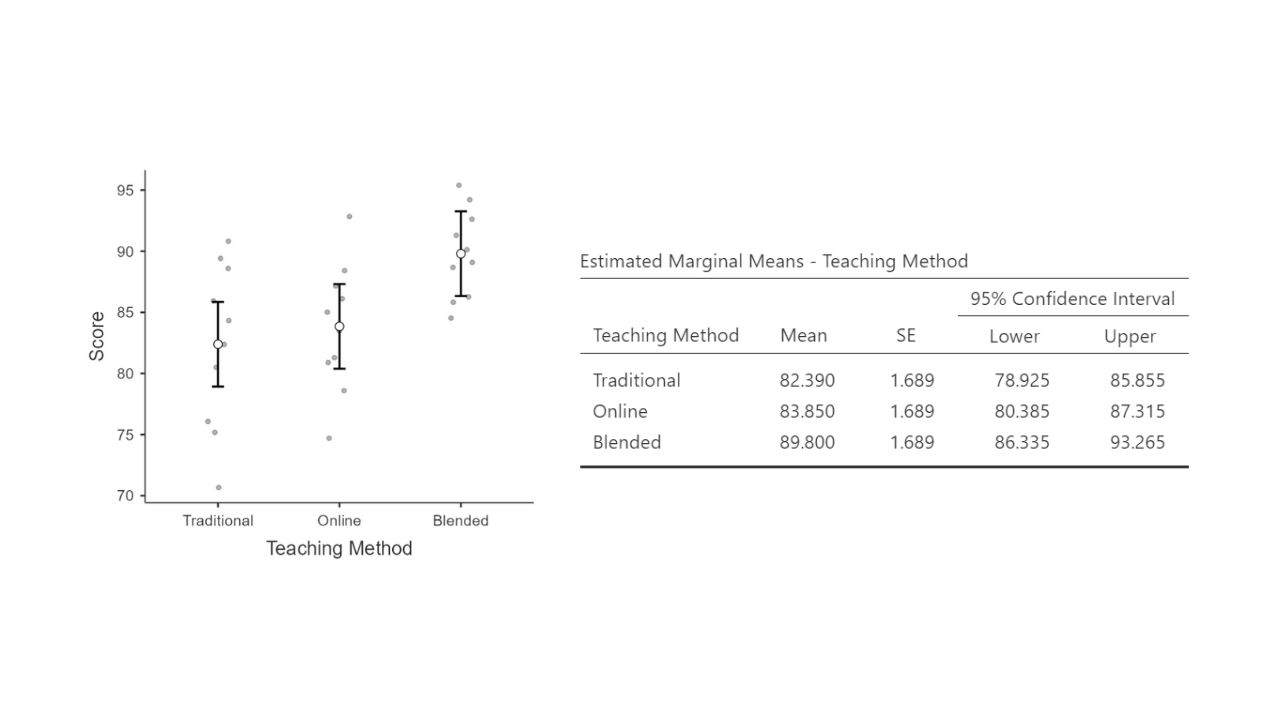
EXTRA: Create graphical representations of the data, such as box plots or bar charts, to visualize the differences among the group means.
Include descriptive summary statistics (e.g., mean, standard deviation) for each group to clearly understand the data. Interpret the results in the context of the research question and discuss the practical implications of the findings.
Following these steps, you can conduct a comprehensive one-way ANOVA analysis and provide meaningful insights into the differences among the groups under study.
Common Mistakes to Avoid
Avoiding common mistakes in one-way ANOVA analysis is essential for accurate and reliable results.
This includes checking and meeting the assumptions of normality and homogeneity of variances and being cautious when interpreting non-significant results by considering the context, sample size, and statistical power.
It’s essential to choose the right post hoc test based on the data and assumptions and to consider effect size and practical significance alongside p-values.
When assumptions are violated, consider using data transformations, robust methods, or nonparametric tests.
Additionally, consistently report descriptive statistics like mean and standard deviation for each group and visualize the data using box plots or bar charts to support and enhance interpretation.
By avoiding these mistakes, you can provide meaningful insights into the differences among the groups under study.
Conclusion
One-way ANOVA is a powerful statistical tool for comparing the means of 3 or more groups and determining whether they have a significant difference.
By carefully considering the assumptions, interpreting the results accurately, and avoiding common mistakes, you can draw meaningful conclusions from your data and contribute valuable insights to your field of study.
We have discussed the importance of verifying the assumptions, choosing the appropriate post hoc tests, and considering the statistical and practical significance of the findings.
We have also highlighted the value of reporting descriptive statistics and visualizing the data to comprehensively understand the results.
As you conduct one-way ANOVA analyses in your research, always remember to:
1. Check the assumptions and address any violations.
2. Perform the analysis with care, considering both p-values and effect sizes.
3. Use appropriate post hoc tests to identify specific differences among the groups.
4. Report descriptive statistics and visualize the data to support your conclusions.
Following these guidelines will enable you to conduct a thorough one-way ANOVA analysis and contribute valuable knowledge to your field.
Remember that the ultimate goal is to reveal the statistical significance and uncover your findings’ practical implications and real-world impact.
FAQ About One Way ANOVA
Q1: What is one-way ANOVA? One-way ANOVA is a statistical tool used to test the differences among the means of three or more independent groups. It helps determine if there is a significant difference between the means or the differences are due to random variation.
Q2: What are the assumptions of one-way ANOVA? The assumptions of one-way ANOVA are independence of observations, normality of residuals (errors), and homogeneity of variances.
Q3: How do I check the assumptions for one-way ANOVA? You can check normality using histograms, Q-Q plots, or tests like Shapiro-Wilk or Kolmogorov-Smirnov. The homogeneity of variances can be checked using Levene’s or Bartlett’s tests.
Q4: What should I do if my data fails to meet the assumptions of one-way ANOVA? You can transform the data, using corrections like Welch’s ANOVA or applying nonparametric alternatives like the Kruskal-Wallis test.
Q5: How do I interpret the results of one-way ANOVA? Report the p-value and effect size from the analysis. If the p-value is less than the predetermined significance level (e.g., 0.05), there is a significant difference among the groups. Use post hoc tests to identify specific group differences.
Q6: What are some typical mistakes to avoid in one-way ANOVA? Some common mistakes include not checking the assumptions, interpreting non-significant results without considering context or power, using incorrect post hoc tests, and not considering effect size and practical significance.
Q7: What are some alternative tests to one-way ANOVA? Alternative tests include Welch’s ANOVA (for unequal variances) and the Kruskal-Wallis test (a nonparametric alternative).
Q8: What are post hoc tests, and when should I use them? Post hoc tests are used after a significant one-way ANOVA result to identify specific pairs of groups with significant differences in their means. Examples include Tukey’s HSD, Bonferroni, and Scheffe’s test.
Q9: How do I visualize the results of one-way ANOVA? You can create box plots or bar charts to visualize the differences among the group means. Additionally, report each group’s descriptive summary statistics (e.g., mean, standard deviation).
Q10: Can I use one-way ANOVA for only two groups? While technically possible, it is more common to use an independent samples t-test for comparing the means of two groups, as it is designed specifically for that purpose.
Explore FREE samples from our recently released digital book and unleash your full potential.
Immerse yourself in advanced data analysis techniques, master the art of determining optimal sample sizes, and learn to communicate results effectively, clearly, and concisely.
Click the link to unlock a treasure trove of knowledge: Applied Statistics: Data Analysis.