Chebyshev’s Theorem Calculator: A Tool for Unlocking Statistical Insights
You will learn how to use Chebyshev’s Theorem Calculator for data analysis.
Introduction
Chebyshev’s Theorem is a fundamental statistical principle that provides a quantifiable measure for the dispersion of data around its mean, applicable to any data distribution. It establishes that a minimum percentage of data points will fall within a certain number of standard deviations from the mean for any dataset. This theorem is crucial for statistical analysis, enabling the application of statistical methods to a wide array of datasets with unknown or non-normal distributions. Integrating Chebyshev’s Theorem Calculator facilitates the theorem’s application by converting mathematical calculations into a straightforward, interactive tool. This calculator enhances the efficiency and accuracy of statistical analyses by providing a clear, concise means to apply Chebyshev’s Theorem to empirical data, making it a vital tool for both educational purposes and professional statistical analysis.
Highlights
- Chebyshev’s theorem applies to any data distribution, ensuring wide-ranging utility.
- The calculator simplifies complex statistical calculations, fostering accessibility.
- Accuracy in statistical analysis is significantly improved with this tool.
- Real-world examples demonstrate the theorem’s practical applications.
- The calculator aids in visualizing data dispersion, enhancing understanding.
Ad Title
Ad description. Lorem ipsum dolor sit amet, consectetur adipiscing elit.
Chebyshev’s Theorem: A Closer Look
Chebyshev’s theorem is integral to statistical analysis, offering a method to quantify the dispersion of data around the mean for any distribution. The theorem states that a defined minimum percentage of observations for any dataset will be within a specified number of standard deviations from the mean. Formally, the theorem is represented as P(∣X−μ∣≥kσ)≤1/k2, where X is a random variable, μ denotes the mean, σ is the standard deviation, and k represents the number of standard deviations from the mean.
This mathematical formulation provides a clear, quantitative framework for data analysis. Any k>1 ensures that at least 1−1/k2 of the observations in a dataset are contained within k standard deviations from the mean; for instance, choosing k=2 guarantees that a minimum of 75% of observations fall within two standard deviations from the mean, applicable to any data distribution.
Chebyshev’s theorem allows for precise statements about the proportion of data surrounding the mean within a calculable range when analyzing datasets with varied values. This capability is crucial for making reliable statistical inferences, particularly with datasets of unknown or non-normal distributions.
Implementing Chebyshev’s Theorem Calculator simplifies the application of this theorem, converting intricate mathematical computations into an accessible, interactive format. This tool facilitates the practical application of Chebyshev’s theorem in data analysis, enhancing the accuracy and efficiency of statistical studies and serving as a crucial resource for both instructional and applied statistical endeavors.
How to Use a Chebyshev’s Theorem Calculator
Using Chebyshev’s Theorem Calculator involves a straightforward process of effortlessly applying Chebyshev’s inequality to your data analysis. This step-by-step guide will walk you through using the calculator to estimate the minimum proportion of values within a specified number of standard deviations from the mean applicable to any data distribution.
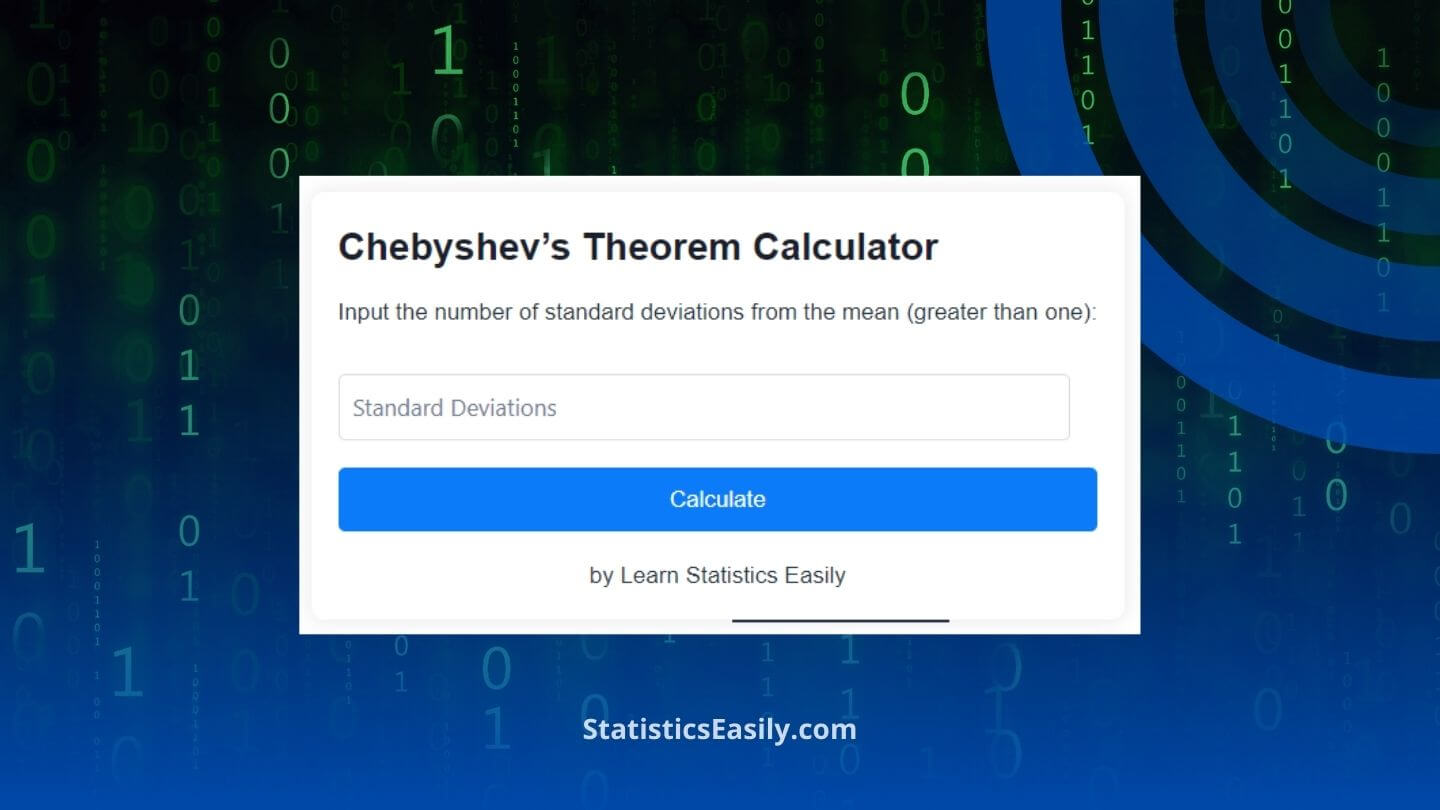
- Open the Calculator: Access Chebyshev’s Theorem Calculator above. The interface is user-friendly, with a clean design focused on ease of use.
- Input Standard Deviations: In the input field labeled “Input the number of standard deviations from the mean (greater than one):”, enter the number of standard deviations (k) from the mean you’re interested in. The value of k must be greater than one to apply Chebyshev’s inequality correctly.
- Calculate: Click the “Calculate” button after entering a valid number. The calculator processes the input using the formula 1−1/k2 to determine the minimum percentage of data values within the specified standard deviations from the mean.
- View Results: The result will be displayed under the button in the “result” section. It provides a clear statement, such as “At least XX.XX% of data values will lie within k standard deviation(s) from the mean for any distribution shape, extending from k standard deviations below to k standard deviations above the mean.” This gives you a precise and immediate understanding of the dispersion of your data about the mean.
- Interpretation: The result offers valuable insights into the distribution of your data, allowing you to make informed decisions based on the proportion of data falling within the specified range. This can be particularly useful in fields where data variability and reliability
Chebyshev’s Theorem Calculator
Input the number of standard deviations from the mean (greater than one):
by Learn Statistics Easily
Conclusion
This article has elucidated the foundational principles and practical applications of Chebyshev’s Theorem, a cornerstone of statistical analysis applicable across diverse data distributions. By integrating Chebyshev’s Theorem Calculator, we’ve demonstrated how this essential statistical tool can significantly enhance data analysis tasks’ efficiency, accuracy, and comprehensibility. By bridging theoretical concepts with practical utility, the calculator is a testament to the theorem’s enduring value in facilitating more profound insights into data dispersion and reliability. We encourage readers to further engage with the calculator and explore the theorem’s broader implications, embarking on a journey of discovery that reveals the intrinsic beauty and profound truth underlying statistical analysis.
Ad Title
Ad description. Lorem ipsum dolor sit amet, consectetur adipiscing elit.
Recommended Articles
Delve deeper into the realm of statistics with our curated articles. Expand your knowledge and uncover more tools and techniques that bring data to life.
- Correlation Coefficient Calculator: Mastering Pearson Coefficients with Our Custom Tool
- The Union and Intersection of Two Sets: A Fundamental Approach to Set Analysis
- Confidence Interval Calculator: Your Tool for Reliable Statistical Analysis
- Chi-Square Calculator: Enhance Your Data Analysis Skills
- The Empirical Rule Calculator
Frequently Asked Questions (FAQs)
Q1: What is Chebyshev’s Theorem? Chebyshev’s theorem is a fundamental statistical principle that provides a minimum probability for the distribution of values within a specified number of standard deviations from the mean, applicable to any data set regardless of its distribution.
Q2: How does the Chebyshev’s Theorem Calculator work? The calculator uses the theorem to determine the minimum proportion of observations within a certain number of standard deviations from the mean, offering a quick and accurate way to apply this statistical concept.
Q3: Why is Chebyshev’s Theorem important in statistics? It allows statisticians to make assertions about data distribution without knowing the exact distribution, making it invaluable for analyzing diverse data sets.
Q4: Can Chebyshev’s Theorem be applied to any distribution? One of the theorem’s key strengths is its applicability to any shaped distribution, providing versatility in statistical analysis.
Q5: What information do I need to use the calculator? You need to know your dataset’s mean, standard deviation, and the number of standard deviations away from the mean you are interested in.
Q6: What does the calculator’s output represent? The output gives the minimum percentage of data that falls within the specified range of standard deviations from the mean, according to Chebyshev’s inequality.
Q7: How can the calculator aid in data analysis? It simplifies estimating the data spread, helping analysts and researchers quickly assess the reliability and variability of their data.
Q8: Are there limitations to using Chebyshev’s Theorem? While powerful, the theorem provides a conservative estimate and may not always give the tightest bounds for data distribution.
Q9: How can I trust the results from this calculator? The calculator is based on a well-established statistical theorem, ensuring the reliability of its results when used correctly.
Q10: Where can I learn more about applying Chebyshev’s Theorem? Our blog offers many resources and articles on statistical theorems and their applications, providing deeper insights into Chebyshev’s theorem and beyond.