Fisher’s Exact Test: A Comprehensive Guide
You will learn the pivotal role and application of the Fisher’s Exact Test in rigorous statistical analysis.
Introduction
Fisher’s Exact Test is a pivotal tool in statistical analysis, particularly revered for its precision in handling small sample sizes within 2×2 contingency tables. Conceived by Ronald A. Fisher in the early 20th century, this test marked a significant advancement in statistics, offering a rigorous alternative to the Chi-square test, especially in scenarios where the latter’s assumptions do not hold.
Historically, Fisher introduced this exact test within agricultural research to analyze the association between various data sets with limited samples. Its historical roots underscore its significance, not just as a statistical method but as a reflection of the evolving nature of research methodologies over time. This test’s ability to provide exact p-values instead of approximate ones derived from larger sample-based tests underscores its critical role in research where precision is paramount.
In contemporary research, Fisher’s Exact Test‘s relevance transcends its original applications, extending into medicine, biology, and social sciences. Its robustness makes it indispensable for researchers dealing with small data sets, ensuring reliable and valid conclusions. The test’s importance is further magnified in today’s data-driven landscape, where the integrity of statistical analysis forms the backbone of evidence-based findings.
This guide aims to unravel the complexities of Fisher’s Exact Test, offering a comprehensive overview that illuminates its theoretical foundations, practical applications, and its indispensable role in modern statistical analysis. Through a clear, objective, and detailed exposition, readers will gain a thorough understanding of this test, equipping them with the knowledge to apply it confidently in their research endeavors.
Highlights
- Fisher’s Exact Test excels in analyzing small sample sizes with precise results.
- Unlike the Chi-square test, Fisher’s test is not restricted by expected frequencies.
- This test is vital for exact hypothesis testing in 2×2 contingency tables.
- Applicable in fields requiring stringent data analysis, such as genetics and medicine.
- Advanced software facilitates Fisher’s test, enhancing research accuracy and efficiency.
Ad Title
Ad description. Lorem ipsum dolor sit amet, consectetur adipiscing elit.
Theoretical Foundations
Fisher’s Exact Test is grounded in the core statistical principle of contingency table analysis, which focuses on determining whether there is a non-random association between two categorical variables. This test is particularly suited for 2×2 contingency tables, which represent the simplest form of data classification with two variables that can each take on two different values.
At its heart, Fisher’s Exact Test calculates the probability of observing the data as it is, given the null hypothesis of no association between the variables. It does this by considering all possible arrangements of the observed data that could occur, maintaining the row and column totals fixed. The test then sums the probabilities of these arrangements that are as extreme or more extreme than the observed arrangement, thereby computing the p-value.
Compared to other statistical tests like the Chi-square test, Fisher’s test is uniquely reliable when sample sizes are small. The Chi-square test relies on an approximation to the chi-square distribution, which becomes more accurate as the sample size increases. However, this approximation can be poor with small sample sizes or when the data contains cells in the contingency table with expected frequencies less than 5, leading to inaccurate p-values. In such cases, Fisher’s Exact Test is preferred due to its exact nature, not relying on any approximation or large sample assumptions.
Fisher’s Exact Test is particularly preferred in the following conditions:
- Small Sample Sizes: When the dataset is small, ensuring the test provides exact results.
- Low Expected Frequencies: In cases where any expected frequency in a 2×2 contingency table is less than 5, which is a common rule of thumb for when the Chi-square approximation may not be reliable.
- Requirement for Precision: In studies where the exact p-value is critical, particularly in fields requiring stringent significance levels like medical research.
Understanding these theoretical foundations is crucial for researchers and analysts to discern when Fisher’s Exact Test is the most appropriate tool for their hypothesis testing, ensuring the integrity and reliability of their conclusions. Through this detailed exploration of the test’s principles and its comparison with other statistical methods, we aim to equip readers with the knowledge to judiciously apply the Fisher’s Exact Test in their research, upholding the highest standards of statistical analysis.
Selecting the Appropriate Statistical Test
In statistical analysis, choosing the correct test based on the dataset’s characteristics is crucial, mainly when dealing with categorical data. This decision is essential to ensure the validity of the test results. Researchers face the common dilemma of using the chi-square test, applying Yates’ continuity correction, or conducting Fisher’s Exact Test. Each method has its context of applicability, often determined by the size of the dataset and the expected frequencies within the contingency table.
The following flowchart provides a straightforward guide for researchers to navigate this decision-making process:
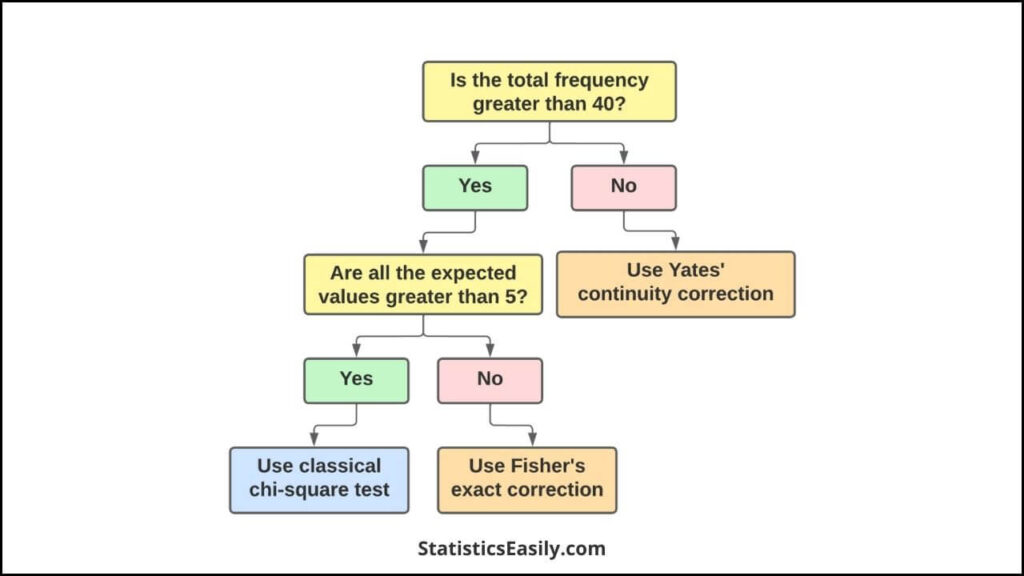
Flowchart Explanation:
- Total Frequency Greater Than 40: If the combined frequency of all cells in your contingency table exceeds 40, the dataset may be sufficiently large for the classical chi-square test.
- Expected Values Greater Than 5: The chi-square test is appropriate without any correction when the expected frequency in each table cell is above 5.
- Yates’ Continuity Correction: For total frequencies of 40 or less, Yates’ correction is recommended to account for the overestimation of chi-square values in small samples.
- Fisher’s Exact Test: If any expected cell frequency is 5 or less, Fisher’s Exact Test is the appropriate choice, as it provides an exact p-value without reliance on the approximations necessary for the chi-square test.
Note on Yates’ Continuity Correction and Fisher’s Exact Test:
When the total sample size is less than 40, a critical decision arises between using Yates’ continuity correction for the chi-square test and Fisher’s Exact Test. Historically, Yates’ correction was applied to adjust the chi-square test for small sample sizes, reducing the chi-square value to correct the overestimation of significance. This correction introduces a conservative bias, potentially leading to a Type II error. However, with advances in computational resources, Fisher’s Exact Test is increasingly favored regardless of sample size due to its precision. It computes the exact probability of the observed data under the null hypothesis without resorting to approximations. As such, Fisher’s Exact Test is generally preferred when dealing with small datasets or when the expected frequencies in any cell of the 2×2 table are less than 5, ensuring the robustness and reliability of the inferential conclusions drawn from the analysis.
Calculations and Interpretations
Performing Fisher’s Exact Test involves meticulously analyzing data within a 2×2 contingency table. This guide provides a step-by-step methodology to ensure clarity and precision in applying this statistical test.
1. Constructing the 2×2 Contingency Table: Begin by organizing your data into a 2×2 table, categorizing each observation based on two independent variables. For instance, using our dataset, the table categories could be ‘Treatment Group’ (Received New Medication, Did Not Receive New Medication) versus ‘Outcome’ (Recovered, Not Recovered).
| Success | Failure | Total | |
|---|---|---|---|
| Group 1 | a | b | a+b |
| Group 2 | c | d | c+d |
| Total | a+c | b+d | N |
2. Calculating the Test Statistic: Fisher’s Exact Test assesses the probability of obtaining the observed data distribution and any more extreme distributions under the null hypothesis of no association between the variables. The probability for each distribution is calculated using the hypergeometric distribution formula.
3. Computing the P-Value: Sum the probabilities of all distributions as extreme or more extreme than the observed one to find the p-value. A lower p-value indicates that the observed association is unlikely to have occurred by chance under the null hypothesis.
Note: Calculating the test statistic and computing the p-value for Fisher’s Exact Test involves intricate statistical processes to assess the probability of obtaining the observed data distribution and any more extreme distributions, assuming no association exists between the variables. Due to its complexity, this calculation, using the hypergeometric distribution formula, makes manual computation impractical and time-consuming. Consequently, these steps are typically performed using specialized statistical software programs. These programs efficiently sum the probabilities of all possible distributions as extreme or more extreme than the observed distribution to determine the p-value.
4. Interpreting the Results: A p-value below the chosen significance level (commonly 0.05) suggests rejecting the null hypothesis, indicating a significant association between the variables. Conversely, a p-value above the threshold suggests insufficient evidence to reject the null hypothesis.
Common Misconceptions and Pitfalls
Misinterpretation of Significance: A significant p-value does not imply a large or important association; it merely indicates that the observed association is unlikely to be due to chance.
Over-reliance on P-Values: Solely focusing on p-values can overlook the practical significance of the findings. Always consider effect sizes and confidence intervals to assess real-world relevance.
Inappropriate Application: Fisher’s Exact Test is designed for small sample sizes. Applying it to large datasets without considering the computational intensity can lead to inefficiencies.
Software and Tools
Fisher’s Exact Test stands out in statistical analysis for its precision, especially when dealing with small sample sizes in 2×2 contingency tables. Given the intricate calculations involved, particularly the hypergeometric distribution formula, manual computation is not feasible for most researchers. This is where specialized software and online tools become indispensable, offering efficiency and accuracy.
Popular Statistical Software
R, an open-source programming language, is widely regarded for its extensive statistical capabilities, including performing Fisher’s Exact Test. R’s comprehensive libraries, such as stats, provide functions like ‘fisher.test()’, simplifying these complex calculations.
Tutorial on Using R for Fisher’s Exact Test
1. Install R and RStudio: Ensure you have R and RStudio installed on your computer. RStudio provides an accessible interface for R, making writing and executing code easier.
2. Prepare Your Data: Import your dataset into R. Your data should be in a 2×2 contingency table format for Fisher’s Exact Test.
3. Use the ‘fisher.test()’ Function: Apply the ‘fisher.test()’ function to your contingency table. For instance, if your table is stored in a variable named ‘table’, the command would be ‘result <- fisher.test(table)’.
4. Interpret the Results: The ‘fisher.test()’ function will return an object containing several pieces of information, including the p-value, which is crucial for determining the significance of your results.
# Installing necessary packages
install.packages("vcd")

# Loading the package
library(vcd)

# Defining your 2x2 contingency table
table <- matrix(c(10, 2, 3, 9), nrow = 2,
                dimnames = list(c("Medication", "Placebo"),
                                c("Success", "Failure")))

# Executing Fisher's Exact Test
result <- fisher.test(table)

# Displaying the Odds Ratio
odds_ratio <- result$estimate
cat("Odds Ratio:", odds_ratio, "\n")

# Calculating Cramér's V
cramers_v <- sqrt(chisq.test(table)$statistic / sum(table))
cat("Cramér's V:", cramers_v, "\n")

# Calculating the Phi Coefficient
phi_coefficient <- sqrt(chisq.test(table)$statistic / sum(table))
cat("Phi Coefficient (φ):", phi_coefficient, "\n")
Effect Size Consideration
Understanding the magnitude of the association revealed by Fisher’s Exact Test is crucial for a comprehensive analysis. Alongside the odds ratio, other measures like Cramér’s V and the Phi Coefficient (φ) enrich our understanding of effect size:
- Odds Ratio: Illuminates the relative odds of an outcome occurring in one group compared to another, offering a direct measure of effect size in 2×2 contingency tables.
- Cramér’s V: This provides a standardized measure of association strength between two nominal variables. It is applicable to tables of any size, including 2×2. It ranges from 0 (no association) to 1 (perfect association).
- Phi Coefficient (φ): Specifically designed for 2×2 tables, the Phi Coefficient is another measure of association strength. It’s equivalent to Cramér’s V for 2×2 tables and ranges from 0 to 1. The Phi Coefficient is particularly useful for its interpretative simplicity in binary variable contexts.
Tips for Troubleshooting Common Issues
Data Format Errors: Ensure your data is correctly formatted as a 2×2 matrix or table before attempting to run the test. R can produce errors if the data is not in the expected format.
Package Installation: If R returns an error stating that a package is missing, install the required package using the ‘install.packages(“packageName”)’ command, replacing ‘”packageName”‘ with the name of the needed package.
Interpreting Output: Familiarize yourself with the ‘fisher.test()’ output. The primary focus is usually on the p-value. However, the function also returns estimated odds ratios and confidence intervals, which can provide additional insights.
Case Studies and Applications
Fisher’s Exact Test has been instrumental across various fields, providing critical insights where precision in statistical analysis is paramount. This section delves into real-world examples illustrating the test’s versatility and impact.
Medicine: Drug Efficacy in Small Sample Trials
In a groundbreaking study, researchers investigated the efficacy of a new treatment for a rare condition. Given the condition’s rarity, the sample size was inherently small. Fisher’s Exact Test was pivotal in analyzing the treatment’s success rate against a placebo, leading to significant findings that influenced subsequent clinical practices.
Biology: Genetic Trait Association in Small Populations
Biologists often encounter small populations in studies of endangered species or isolated ecosystems. In one such study, Fisher’s Exact Test examined the association between a genetic trait and survival rates, providing insights critical for conservation strategies.
Social Sciences: Impact of Educational Programs
Social scientists employed Fisher’s Exact Test to evaluate the impact of a pilot educational program on student performance. With schools carefully selected for the pilot, the small sample size necessitated a precise analysis, revealing the program’s effectiveness and guiding policy decisions.
Effect Size in Context
Incorporating effect size measures like Cramér’s V and the Phi Coefficient, researchers not only established statistical significance but also gauged the strength of associations, enriching their findings with deeper insights.
Ad Title
Ad description. Lorem ipsum dolor sit amet, consectetur adipiscing elit.
Conclusion
As we conclude this comprehensive exploration of Fisher’s Exact Test, we reflect on the key points that cement its value in statistical analysis. This test, named after the eminent statistician Ronald A. Fisher, has demonstrated an unwavering utility in research, particularly when precise evaluation of small sample sizes is required. Its exact nature, free from the reliance on large-sample assumptions that underpin the Chi-square test, ensures its continued relevance in various scientific fields.
Throughout this guide, we have illuminated the theoretical underpinnings that make Fisher’s Exact Test a robust alternative for analyzing 2×2 contingency tables, especially when expected frequencies fall below five. We’ve explored the practicalities of performing the test, the importance of selecting the appropriate statistical method, and the common pitfalls to avoid, emphasizing the need for accuracy and clarity in research outcomes.
Our journey has taken us through real-world applications, demonstrating the test’s adaptability and impact — from medicine to biology to the social sciences. The discussion on advanced topics and recent advancements has provided a glimpse into the potential evolution of exact testing, promising further innovation and enhancement of the statistical tools at our disposal.
In essence, Fisher’s Exact Test is more than a mere computational procedure; it embodies the quest for rigor and integrity in research. It exemplifies our commitment to upholding the principles of truth, goodness, and beauty in scientific inquiry — principles that guide us toward meaningful discoveries and the advancement of knowledge. As researchers and analysts, we wield this test as a mathematical instrument and a beacon of our dedication to pursuing verifiable and reliable evidence.
Recommended Articles
Dive deeper into statistical mastery — explore our articles on related topics here.
- How to Report Chi-Square Test Results in APA Style: A Step-By-Step Guide
- Understanding the Assumptions for Chi-Square Test of Independence
- What is the Difference Between the T-Test vs. Chi-Square Test?
- Effect Size for Chi-Square Tests: Unveiling its Significance
- Mastering the Chi-Square Test: A Comprehensive Guide
- Understanding the Null Hypothesis in Chi-Square
Frequently Asked Questions (FAQs)
Q1: What does a Fisher’s exact test tell you? It reveals the significance of the association between two categorical variables in small datasets.
Q2: Is Fisher’s exact test Qualitative or quantitative? It’s qualitative, analyzing categorical data within contingency tables for exact hypothesis testing.
Q3: Does Fisher’s exact test have to be 2×2? Initially designed for 2×2 tables, it has been adapted for larger tables with more complex methods.
Q4: What is the p-value from Fisher’s exact test? The p-value indicates the probability that the observed data occurred by chance under the null hypothesis.
Q5: When is Fisher’s Exact Test most appropriately used? It is ideal for small sample sizes or sparse contingency table data, ensuring accurate hypothesis testing.
Q6: How is the Fisher’s Exact Test applied across various fields? Its rigorous analytical approach benefits fields like medicine, genetics, and social sciences, where precise data analysis is crucial.
Q7: What distinguishes Fisher’s Exact Test from other statistical tests? Its ability to provide exact p-values without reliance on large sample size assumptions sets it apart from approximative tests like the Chi-square.
Q8: Can Fisher’s Exact Test be performed with standard statistical software? Tools such as R and Python offer robust packages for conducting Fisher’s Exact Test, with tutorials for guidance.
Q9: How do extensions of Fisher’s Exact Test accommodate larger tables? Advanced methodologies extend the test’s applicability beyond 2×2 tables, addressing more complex data arrangements.
Q10: Where can further insights into Fisher’s Exact Test be found? Explore our blog for in-depth articles, tutorials, and case studies to deepen your understanding of Fisher’s Exact Test.ch.