
How to Interpret Confidence Intervals?
The interpretation of a confidence interval involves understanding the range within which the actual population parameter is likely to fall, given a specified confidence level. It helps assess the precision and uncertainty of the estimate, informing data-driven decisions.
Highlights
- The confidence interval provides a range of plausible values for a population parameter.
- The confidence level indicates the proportion of calculated intervals containing the true parameter.
- A narrow confidence interval suggests a more precise estimate.
- A wide confidence interval indicates greater uncertainty in the estimate.
- Accurate interpretation of confidence intervals is crucial for data-driven professionals.
Introduction to Confidence Intervals
Confidence intervals are an essential concept in statistics and data analysis. They give a range of values within which a population parameter (e.g., mean) will likely fall.
Interpreting a confidence interval is a crucial skill for any data-driven professional, as it helps us understand the uncertainty associated with our estimates.
Importance of Confidence Intervals
Understanding the interpretation of a confidence interval is vital for several reasons:
Confidence intervals measure uncertainty
They give us a range of plausible values for a population parameter rather than just a single-point estimate. This helps us assess the precision of our estimates.
Confidence intervals support decision-making
By understanding the uncertainty in our estimates, we can make better-informed decisions based on the available data.
Confidence intervals facilitate hypothesis testing
They allow us to determine if a particular value is within or outside the range of plausible values for a population parameter, helping us to draw conclusions about the population.

🛑 Stop Struggling with Data Analysis
Find Out How Our eBook Can Turn You into an Expert Overnight!
Interpretation of a Confidence Interval
The interpretation of a confidence interval focuses on the understanding that the range of values represents plausible values for the population parameter.
A narrow confidence interval suggests that the estimate is precise. In contrast, a wide confidence interval indicates more uncertainty, implying a less precise estimate.
This interpretation helps assess our estimates’ accuracy and the confidence level we can have in the results.
Considering the associated confidence level, such as 95% or 99%, is essential when interpreting a confidence interval.
The confidence level indicates the proportion of confidence intervals calculated from repeated sampling containing the true population parameter.
For example, a 95% confidence interval means that if we repeated the sampling process many times, 95% of the calculated confidence intervals would contain the true population parameter.
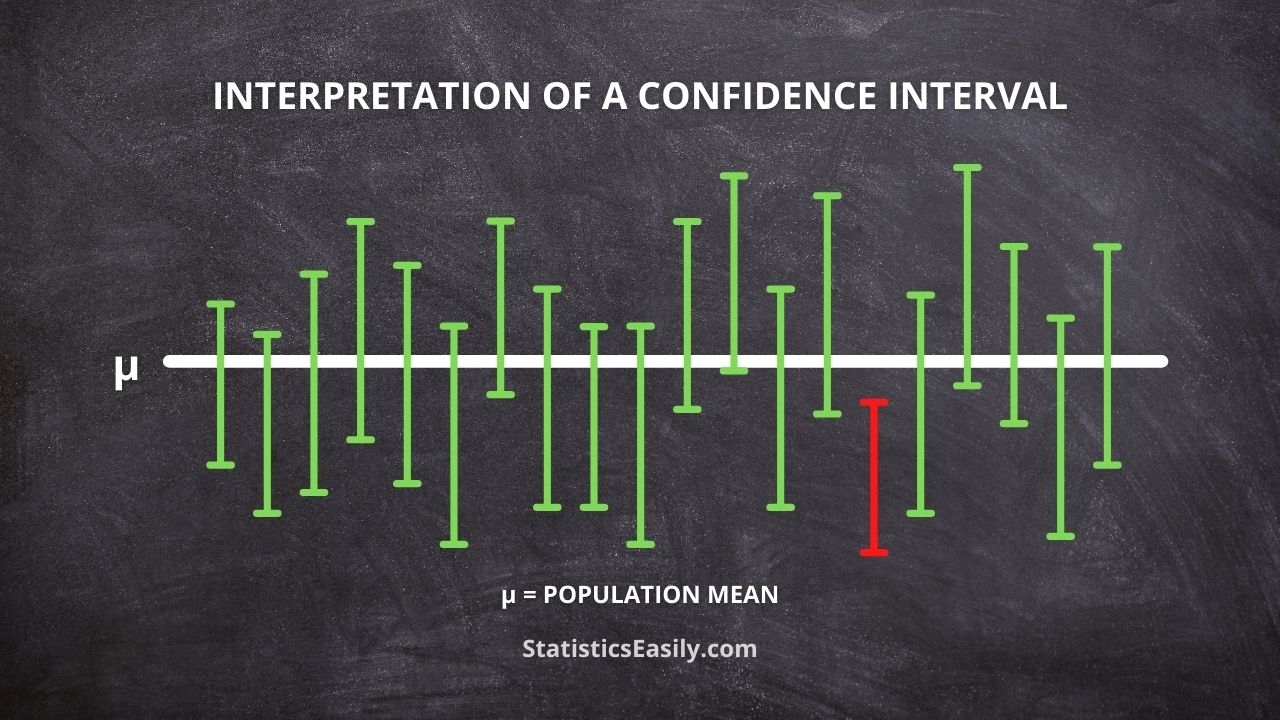
It is crucial not to confuse this with the probability of the true population parameter falling within the interval.
Additionally, the interpretation of a confidence interval should consider the underlying assumptions and the sample size.
The validity of a confidence interval relies on the sample being representative of the population and meeting other statistical assumptions, such as normality.
Violating these assumptions can lead to misleading results.
Moreover, the sample size significantly impacts the width of the confidence interval; larger sample sizes generally result in narrower intervals, while smaller sample sizes produce wider intervals.
Recognizing these factors is crucial for accurate and meaningful interpretation of confidence intervals.
Table 1: Step-by-step example of calculating a confidence interval.
| Step # | Description | Example Calculation |
|---|---|---|
| 1 | Collect a sample from the population. | Sample of 30 students' test scores. |
| 2 | Calculate the sample statistic (e.g., mean) and the standard error. | Mean = 75, Standard Error (SE) = 3.5 |
| 3 | Determine the appropriate critical value from a t-distribution based on the desired confidence level and degrees of freedom. | Confidence level = 95%, degrees of freedom = 29, t-score (critical value) = 2.045 |
| 4 | Multiply the critical value by the standard error. | 2.045 * 3.5 = 7.16 |
| 5 | Add and subtract the product from step 4 to the sample statistic to obtain the lower and upper bounds of the confidence interval. | 75 - 7.16 = 67.84 (lower bound), 75 + 7.16 = 82.16 (upper bound) |
| Result | Confidence Interval | 67.84 to 82.16 |
This table illustrates the steps to calculate a confidence interval for 30 students’ test scores with a 95% confidence level. Each step is explained alongside its corresponding example calculation.
Real-World Examples of Confidence Interval Interpretation
Understanding the interpretation of a confidence interval is vital for several reasons:
Example 1
A pharmaceutical company conducts a study to estimate the average weight loss of participants using a new drug. They find a 95% confidence interval for the average weight loss of 8.2 to 11.4 pounds. This means they are 95% confident that the true average weight loss lies within this range.
Example 2
A political poll estimates the proportion of voters supporting a particular candidate with a 99% confidence interval of 48.5% to 52.5%. The interpretation of this confidence interval is that we are 99% confident that the true proportion of voters supporting the candidate falls within this range.
Example 3
An environmental researcher measures the pH level of a lake to determine its acidity. They report a 90% confidence interval for the average pH level as 6.8 to 7.2. This means that they are 90% confident that the true average pH level of the lake falls within this range.
Example 4
A marketing team analyzes the average time spent on their website by users. They found a 95% confidence interval for the average 12 to 16 minutes. The interpretation of this confidence interval is that they are 95% confident that the true average time users spend on the website lies within this range.
Common Misconceptions and Pitfalls
When interpreting confidence intervals, it is essential to avoid the following common misconceptions and pitfalls:
Misinterpreting the confidence level
A 95% confidence interval does not mean that there is a 95% chance that the true population parameter falls within the interval. Instead, if we repeated the sampling process many times, 95% of the calculated confidence intervals would contain the actual population parameter.
Assuming that the population parameter is equally likely to be anywhere within the interval
Confidence intervals are derived from probability distributions, which means that the true population parameter is more likely to be closer to the center of the interval rather than the edges.
Failing to account for the margin of error
When interpreting confidence intervals, it is essential to consider the margin of error, representing the amount by which the sample statistic may differ from the true population parameter. For example, a smaller margin of error implies a more precise estimate. In contrast, a larger margin of error indicates greater uncertainty in the estimate.
Ignoring the assumptions and limitations of the confidence interval
Confidence intervals rely on specific assumptions, such as the data being normally distributed or the sample representative of the population. Violating these assumptions can lead to inaccurate and misleading confidence intervals. It’s crucial to evaluate the validity of these assumptions before interpreting the results.
Overlooking sample size
Sample size plays a significant role in the width of a confidence interval. Larger sample sizes generally lead to narrower confidence intervals, while smaller sample sizes result in wider intervals. Therefore, when interpreting a confidence interval, it’s essential to consider the sample size and its effect on the estimate’s precision.
Conclusion
Mastering the interpretation of a confidence interval is crucial for any professional dealing with data and statistical analysis.
It helps us understand the uncertainty associated with our estimates, supports decision-making and facilitates hypothesis testing.
By avoiding common misconceptions and pitfalls, we can ensure we interpret confidence intervals accurately and make better-informed decisions based on the available data.
FAQ: What is an Independent Variable in an Experiment?
Q1: What is a confidence interval?
A confidence interval is a range of values within which a population parameter is likely to fall, given a specified confidence level.
Q2: Why are confidence intervals necessary?
Confidence intervals are essential for assessing the precision and uncertainty of estimates, supporting decision-making, and facilitating hypothesis testing.
Q3: How do I interpret a confidence interval?
Interpret a confidence interval by understanding that the range of values represents plausible values for the population parameter, considering the confidence level.
Q4: What is the relationship between the confidence level and the confidence interval?
The confidence level would indicate the proportion of calculated intervals containing the true population parameter if the sampling process was repeated many times.
Q5: What factors affect the width of a confidence interval?
The width of a confidence interval is affected by the sample size, the standard error, and the critical value from the standard distribution.
Q6: How do sample size and confidence interval width relate?
Larger sample sizes generally result in narrower confidence intervals, while smaller sample sizes produce wider intervals.
Q7: Why is it crucial to consider the underlying assumptions of a confidence interval?
The validity of a confidence interval relies on the sample being representative of the population and meeting other statistical assumptions. Violating these assumptions can lead to misleading results.
Q8: How do confidence intervals support decision-making?
Understanding the uncertainty in our estimates provided by confidence intervals allows us to make better-informed decisions based on the available data.
Q9: How do confidence intervals facilitate hypothesis testing?
Confidence intervals allow us to determine if a particular value is within or outside the range of plausible values for a population parameter, helping us draw conclusions about the population.
Q10: What are common misconceptions about confidence intervals?
Misconceptions include misinterpreting the confidence level, assuming equal likelihood within the interval, and overlooking the margin of error or sample size.
Explore FREE samples from our recently released digital book and unleash your full potential.
Immerse yourself in advanced data analysis techniques, master the art of determining optimal sample sizes, and learn to communicate results effectively, clearly, and concisely.
Click the link to unlock a treasure trove of knowledge: Applied Statistics: Data Analysis.