What’s Regression Analysis? A Comprehensive Guide for Beginners
Regression analysis is a statistical technique used for modeling the relationship between the dependent variable and one or more independent variables, enabling prediction, decision-making, and insights across various fields.
Highlights
- Regression analysis models relationships between dependent and independent variables for prediction and decision-making.
- Linear, logistic, and polynomial are key types of regression, each suited to different data and goals.
- Goodness-of-fit metrics, like R-squared and adjusted R-squared, assess model performance and explainability.
- Regression assumptions include linearity, normality, independence of errors, and homoscedasticity, which must be validated.
- Common pitfalls include confusing correlation with causation, overfitting, multicollinearity, omitted variable bias, and extrapolation.
Ad Title
Ad description. Lorem ipsum dolor sit amet, consectetur adipiscing elit.
What’s regression analysis?
Regression analysis is a cornerstone technique in statistics and data science that allows us to explore and quantify the relationships between variables. It is used to predict outcomes, identify trends, and make data-driven decisions across various fields, from business and finance to healthcare and engineering.
At its core, regression analysis seeks to model the relationship between a dependent variable (the variable we are trying to predict or explain) and one or more independent variables (the factors that influence the dependent variable). By doing so, we can gain insights into our data’s underlying patterns and causal relationships, enabling us to make better predictions and more informed decisions.
The fundamental idea behind regression analysis is to find the best-fitting model that accurately represents the relationship between the dependent and independent variables. This often involves fitting a line or curve to the data points to minimize the differences between the observed and predicted values, known as the residuals.
In practice, regression analysis can take many forms, from simple linear regression, which models the relationship between one dependent and one independent variable, to more advanced techniques, such as multiple polynomial regression, which allow for the analysis of more complex relationships.
As a versatile and powerful statistical tool, regression analysis is essential for anyone looking to make sense of data and draw meaningful conclusions. In this guide, you will learn about the various types of regression analysis, their fundamental concepts, key assumptions and limitations, and practical applications across multiple industries. By understanding what’s regression analysis and mastering its techniques, you will be well-equipped to tackle complex data challenges and make data-driven decisions with confidence.
Types of Regression Analysis
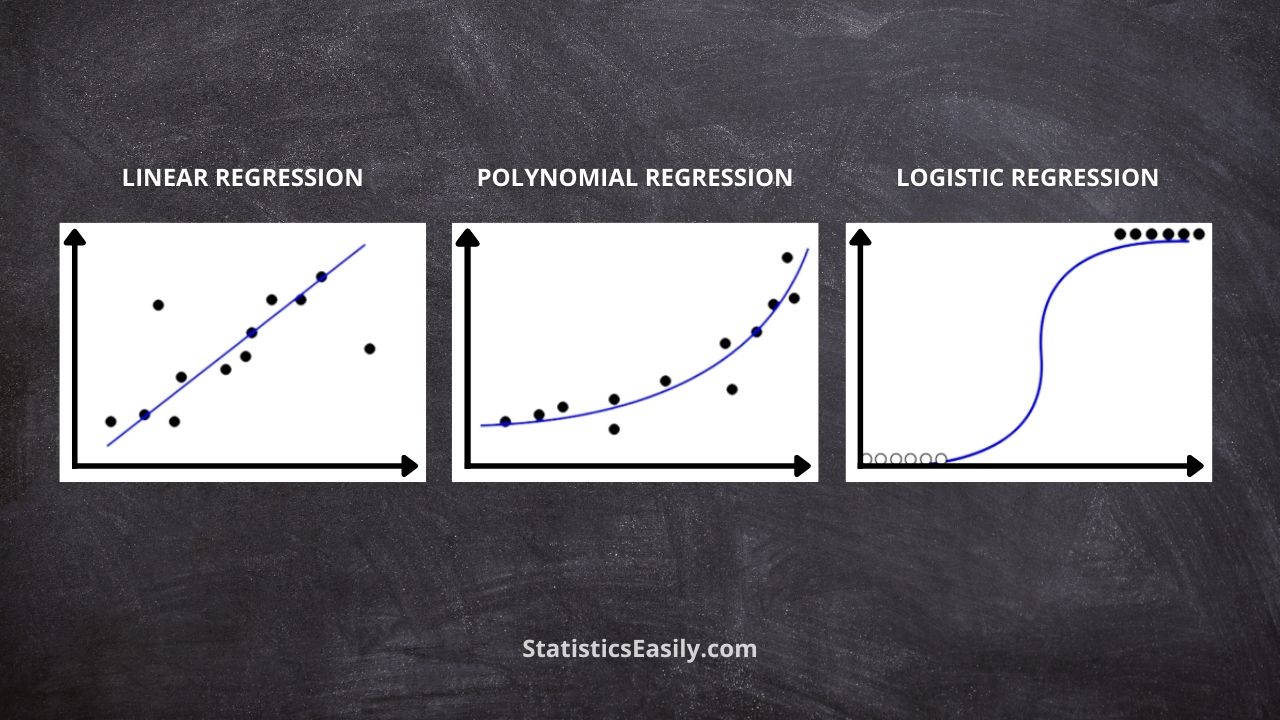
Linear Regression: This is the most basic form of regression analysis to model the relationship between the dependent and independent variables. It assumes a linear relationship between variables, represented by a straight line. The objective is to find the best-fitting line that minimizes the squared differences sum between the observed and predicted values. Linear regression is widely used for forecasting, trend analysis, and identifying the impact of one variable on another.
Logistic Regression: This is a type of regression analysis designed for problems with categorical dependent variables, including binary (two possible outcomes), nominal (unordered categories), and ordinal (ordered categories). Rather than predicting the actual value of the dependent variable, logistic regression estimates the probability of an event occurring based on the independent variable. It employs the logistic function, which transforms the regression model output into a probability value between 0 and 1. Commonly used in fields such as medical research, marketing, and finance, logistic regression is versatile for predicting the likelihood of specific events or outcomes and understanding the impact of various factors on those outcomes.
Polynomial Regression: This is an extension of the linear regression used when the relationship between the dependent and independent variables is nonlinear. Instead of fitting a straight line, a polynomial function is used to model the curvature in the relationship. Polynomial regression can capture more complex patterns in the data, providing a better fit for situations where linear models are inadequate. However, it is essential to be cautious with the choice of polynomial degrees, as overly complex models can lead to overfitting and poor generalization of new data.
*Multiple Regression: Multiple regression is an advanced technique that allows for the inclusion of multiple independent variables, enabling the analysis of more complex relationships between variables and controlling for confounding factors. It is not only a generalization of linear regression. Still, it can also be extended to other types of regression, such as logistic and polynomial regression. Multiple regression aims to find the best-fitting model explaining the relationship between dependent and independent variables.
The Fundamental Concepts of Regression Analysis
Dependent and Independent Variables: In regression analysis, the dependent variable (the response or target variable) is the outcome we try to predict or explain. At the same time, independent variables (also known as predictors, features, or explanatory variables) are the factors that influence the dependent variable. Regression analysis aims to model the relationship between these variables, allowing us to understand the effects of the independent variables on the dependent variable and make predictions.
Coefficients and Intercepts: Coefficients and intercepts are essential components of a regression model. Coefficients represent the effect of the independent variables on the dependent variable, indicating how much the dependent variable changes for each unit increase in the independent variables, assuming all other variables are held constant. The intercept represents the expected value of the dependent variable when all independent variables are equal to zero. These values are estimated using ordinary least squares or maximum likelihood estimation techniques during the model fitting.
The Goodness of Fit and R-squared: The goodness of fit measures how well the regression model fits the observed data. Several metrics can be used to assess the goodness of fit. Still, one of the most common is R-squared (also known as the coefficient of determination). R-squared represents the variance proportion in the dependent variable explained by the model’s independent variables. It ranges between 0 and 1, with higher values indicating a better fit. In multiple regression, it is essential to consider the adjusted R-squared, which accounts for the number of independent variables in the model. The R-squared value can increase as more variables are added, even if the additional variables do not contribute significantly to the model’s predictive power. The adjusted R-squared corrects this issue by penalizing the R-squared value for the inclusion of unnecessary variables. This results in a more accurate model’s performance assessment and helps to prevent overfitting. However, both R-squared and adjusted R-squared should be interpreted cautiously, as a high value does not guarantee a good model. The model may still be susceptible to issues such as multicollinearity, omitted variable bias, or other violations of regression assumptions.
Ad Title
Ad description. Lorem ipsum dolor sit amet, consectetur adipiscing elit.
Key Assumptions and Limitations
Regression analysis relies on several key assumptions common across different types of regression, including linear, logistic, polynomial, and multiple regression extensions. If these assumptions are not met, the accuracy and validity of the model’s predictions and conclusions may be limited. Therefore, it is crucial to understand and assess these assumptions when performing regression analysis.
Appropriate functional form: The relationship between the dependent and independent variables should follow the functional form of the regression model. This means a linear relationship for linear regression, while a polynomial relationship is assumed for polynomial regression. Checking scatterplots or residual plots can help identify violations of this assumption.
Independence of observations: The observations in a dataset should be independent of each other. In autocorrelation (when consecutive observations are related), the regression model may underestimate the true variability in the data, leading to unreliable coefficient estimates and hypothesis tests.
Independence of errors: The residuals (errors) should be independent, meaning that the error for one observation should not influence the error for another. If errors are correlated, the standard errors of the coefficients may be underestimated, leading to incorrect inferences and confidence intervals.
Homoscedasticity (for linear and polynomial regression): The residual variance should be constant across all levels of the independent variables. If the variance changes (a phenomenon called heteroscedasticity), the standard errors of the coefficients may be biased, affecting hypothesis testing and confidence intervals.
Normality of residuals (for linear and polynomial regression): The residuals (i.e., the differences between the observed and predicted values) should follow a normal distribution. Violations of normality can affect hypothesis testing and the validity of confidence intervals.
No multicollinearity: Independent variables should not be highly correlated with one another. Multicollinearity can cause unstable coefficient estimates and make it difficult to interpret the individual contributions of each variable.
Correctly specified link function (for logistic regression): The link function must be correctly defined in logistic regression to transform the predicted values into probabilities. Using an incorrect link function can lead to biased coefficient estimates and inaccurate predictions.
Interpreting the Results of Regression Analysis
Understanding and interpreting regression analysis results is crucial for making better decisions and drawing meaningful conclusions. Here are some key aspects to consider when interpreting the results of any regression model, including linear, logistic, polynomial, and multiple regression:
Coefficient estimates: The coefficients represent the effect of each independent variable on the dependent variable, holding all other variables constant. In linear and polynomial regression, the coefficients indicate the change in the dependent variable for a unit increase in the independent variable. In logistic regression, the coefficients represent the change in the log-odds of the outcome for a unit increase in the independent variable.
Significance of coefficients: Hypothesis tests, such as t-tests or z-tests, are performed to determine the statistical significance of the coefficients. A statistically significant coefficient suggests that the independent variable has a meaningful impact on the dependent variable. A non-significant coefficient implies that the independent variable may not contribute significantly to the model.
Confidence intervals: Confidence intervals estimate the range within which the population coefficient will likely fall. Narrower intervals suggest more precise estimates, while wider intervals indicate greater uncertainty.
Model fit statistics: Goodness-of-fit metrics, such as R-squared, adjusted R-squared, or the Akaike Information Criterion (AIC), can help assess the overall performance of the model. These metrics should be considered alongside other diagnostic measures and plots to evaluate the model’s adequacy.
Residual analysis: Examining the residuals can reveal patterns or trends that suggest violations of regression assumptions or areas where the model does not fit the data well. Residual plots, normal probability plots, and autocorrelation plots can be used to diagnose potential issues and guide model improvement.
Outliers and influential points: Outliers and influential points can significantly impact the regression model. Identifying and addressing these observations by excluding them or using robust regression techniques can help improve the model’s performance.
Validation and generalization: Cross-validation or hold-out validation can be used to assess the model’s performance on new data, helping to gauge its generalizability and prevent overfitting.
Ad Title
Ad description. Lorem ipsum dolor sit amet, consectetur adipiscing elit.
Practical Applications of Regression Analysis
Regression analysis is a powerful statistical tool with many practical applications across diverse industries. The regression analysis can help inform decision-making, optimize processes, and predict future outcomes by modeling the relationship between the dependent and independent variables. Here are some examples of how regression analysis is used in various industries:
Finance and Economics: In finance, regression analysis can be used to model the relationship between stock prices and economic indicators, such as interest rates or unemployment rates. This can help investors make better decisions about portfolio allocation and risk management. Additionally, economists may use regression to study the monetary and fiscal policies’ impact on economic growth and inflation.
Marketing and Sales: Regression models can be employed to analyze the effectiveness of marketing campaigns, understand consumer behavior, and predict sales. For example, businesses can use regression to determine the impact of advertising spending on sales, allowing them to optimize their marketing budget for maximum return on investment.
Healthcare: Regression analysis explores the relationship between patient characteristics and health outcomes in the healthcare industry. This can help identify disease risk factors, inform treatment decisions, and optimize patient care. For instance, logistic regression can predict the likelihood of a patient developing a particular condition based on demographic and clinical variables.
Manufacturing and Quality Control: Regression analysis can optimize manufacturing processes, improve product quality, and reduce production costs. By modeling the relationship between process variables and product characteristics, companies can identify the optimal conditions for achieving desired product specifications while minimizing waste and resource consumption.
Human Resources: In HR management, regression analysis can be used to understand the factors influencing employee performance, retention, and job satisfaction. This can help organizations develop targeted recruitment, training, and employee engagement strategies, ultimately improving productivity and reducing turnover.
Sports Analytics: Regression models are increasingly used in sports analytics to evaluate player performance, inform coaching decisions, and optimize team strategies. For example, multiple regression analysis can quantify individual player statistics’ contribution to team success, helping coaches and managers make more informed roster decisions.
Environmental Science: In ecological research, regression analysis can be employed to model the relationship between environmental factors, such as temperature or precipitation, and ecological outcomes, such as species distribution or ecosystem productivity. This can inform conservation efforts, natural resource management, and policy development.
Common Pitfalls and Misconceptions in Regression Analysis
While regression analysis is a powerful and widely-used statistical tool, it has challenges and potential pitfalls. Being aware of these common misconceptions and issues can help practitioners avoid mistakes and improve the quality of their analysis:
Correlation vs. causation: A common misconception in regression analysis is that correlation implies causation. Although regression can identify relationships between variables, it does not necessarily prove a causal link. Establishing causality requires a deeper understanding of the underlying mechanisms and often involves experimental designs or additional analyses.
Overfitting: Building a model that is too complex or includes too many independent variables can lead to overfitting, where the model captures noise in the data rather than the underlying relationships. Overfit models perform poorly on new data and can lead to misleading conclusions. To prevent overfitting, consider using cross-validation, regularization, or model selection based on information criteria like AIC or BIC.
Multicollinearity: When independent variables are highly correlated, it becomes difficult to interpret the individual contribution of each variable to the model. Multicollinearity can lead to unstable estimates and inflated standard errors. Detecting multicollinearity through variance inflation factors (VIFs) or correlation matrices, and addressing it through techniques like variable selection or dimensionality reduction, can help improve model interpretation and performance.
Omitted variable bias: Excluding important variables from the regression model can result in biased coefficient estimates and misleading conclusions. To avoid omitted variable bias, ensure that all relevant variables are included in the analysis. Consider using stepwise regression or model selection techniques to identify the most important predictors.
Violation of assumptions: Ignoring or failing to test the underlying assumptions of regression analysis can lead to unreliable results. It is essential to assess the validity of the assumptions, such as linearity, independence of errors, and homoscedasticity, and to employ alternative techniques or transformations if necessary.
Extrapolation: Using regression models to make predictions beyond the range of the observed data can be risky, as the relationships between variables may not hold in unobserved regions. Exercise caution when extrapolating predictions, and consider the model’s limitations and the potential for unforeseen factors to influence the outcome.
Misinterpreting coefficients: Interpreting regression coefficients without considering the scale of the variables or the link function (in the case of logistic regression) can lead to confusion and incorrect conclusions. Ensure that the interpretation of coefficients is context-appropriate and considers the units of measurement, the direction of the effect, and the magnitude of the relationship.
Ad Title
Ad description. Lorem ipsum dolor sit amet, consectetur adipiscing elit.
Conclusion
Regression analysis is a powerful and versatile statistical tool enabling practitioners to model the relationships between variables, make predictions, and inform decision-making across various industries. By understanding the fundamental concepts, such as dependent and independent variables, coefficients, and goodness of fit, analysts can select the appropriate type of regression model for their data, including linear, logistic, polynomial, and multiple regression.
However, it is crucial to be aware of regression analysis’s assumptions and limitations and carefully interpret the results to avoid common pitfalls and misconceptions. By considering the assumptions, addressing issues such as multicollinearity and overfitting, and using techniques like cross-validation and regularization, practitioners can build more accurate and generalizable models that contribute valuable insights and drive data-driven decision-making.
In summary, regression analysis is an invaluable tool for understanding complex relationships and solving real-world problems, as long as practitioners are mindful of its potential challenges and limitations and committed to using the method responsibly and effectively.
Recommended Articles
Ready to expand your knowledge? Check out our blog for more relevant articles and deepen your understanding of these crucial statistical tests. Take advantage of the opportunity to enhance your data analysis skills and drive more informed decision-making. Read now!
- How to Report Results of Multiple Linear Regression in APA Style
- How to Report Simple Linear Regression Results in APA Style
- Assumptions in Linear Regression: A Comprehensive Guide
- Logistic Regression Using R: The Definitive Guide
- What Are The Logistic Regression Assumptions?
- What Are The 3 Types of Logistic Regression?
- How to Create Regression Lines in Excel
- Mastering Logistic Regression (Story)
FAQ: What’s Regression Analysis
Regression analysis is a statistical approach to model relationships between dependent and independent variables for prediction and decision-making.
The main types are linear, logistic, polynomial, and multiple regression, each suited to different data types and goals.
Correlation measures the strength and direction of a relationship between variables. At the same time, causation implies that one variable directly influences the other.
Assumptions include linearity, normality, independence of errors, and homoscedasticity, which must be validated for reliable results.
When independent variables are highly correlated, multicollinearity occurs, making it difficult to interpret individual contributions. It can be addressed using variable selection or dimensionality reduction techniques.
Overfitting occurs when a model captures noise rather than underlying relationships, resulting in poor generalizability. It can be prevented using cross-validation, regularization, or model selection.
Coefficients represent the effect of independent variables on the dependent variable while holding other variables constant. Interpretation depends on the type of regression and variable scales.
The residual analysis examines residuals (differences between observed and predicted values) to identify patterns, trends, or violations of regression assumptions, guiding model improvement.
Regression analysis is widely used in finance, marketing, healthcare, manufacturing, HR, sports analytics, and environmental science.
Common pitfalls include confusing correlation with causation, overfitting, multicollinearity, omitted variable bias, extrapolation, and misinterpreting coefficients.