Measures of Central Tendency: Mean, Mode, Median
You will learn the distinct applications and nuances of the central tendency measures mean, mode, median in data analysis.
Introduction
In statistics, the concept of central tendency is pivotal. It encompasses identifying a single value that best represents a data set. This value is critical in understanding a dataset’s overall trend or center. The measures of central tendency — mean, mode, and median — each offers unique perspectives on the data, enabling statisticians and data analysts to derive meaningful insights.
Understanding and applying these measures correctly is fundamental in statistical analysis. They are foundational tools for summarizing and interpreting data, essential in various fields, including economics, psychology, biology, and more. These measures help make informed decisions based on data and understand the general behavior or characteristics of the data set. For a comprehensive analysis, it is crucial to calculate these measures and comprehend their implications in the context of the data’s distribution and characteristics.
Highlights
- The mean is sensitive to outliers, impacting its representativeness in skewed distributions.
- Median provides a better central value in skewed data unaffected by extreme values.
- Mode is critical in understanding the most frequent occurrence in categorical data.
- Comparing these measures can unveil data distribution characteristics.
- Skewed distributions often require median over mean for an accurate central tendency.
Ad Title
Ad description. Lorem ipsum dolor sit amet, consectetur adipiscing elit.
Mean
The mean, often called the average, is a fundamental concept in statistics and data analysis. It is calculated by summing all values in a dataset and dividing this total by the number of values. Mathematically, it’s expressed as:
Mean=n∑i=1nxi
where xi represents each value in the dataset, and n is the number of values.
Applications and Limitations of the Mean
The mean is widely used due to its simplicity and straightforward interpretation. It’s beneficial when the data is normally distributed, as it provides a central location for the data. In fields like economics, psychology, and biology, the mean is used to analyze everything from test scores and temperatures to biological measurements.
However, the mean has its limitations. One of its most significant drawbacks is its sensitivity to outliers — extreme values significantly different from the rest of the data. In skewed distributions, outliers can drastically alter the mean, making it a less reliable measure of central tendency. This can mislead interpretations, especially when the data is not symmetrically distributed.
Visual Aids and Examples
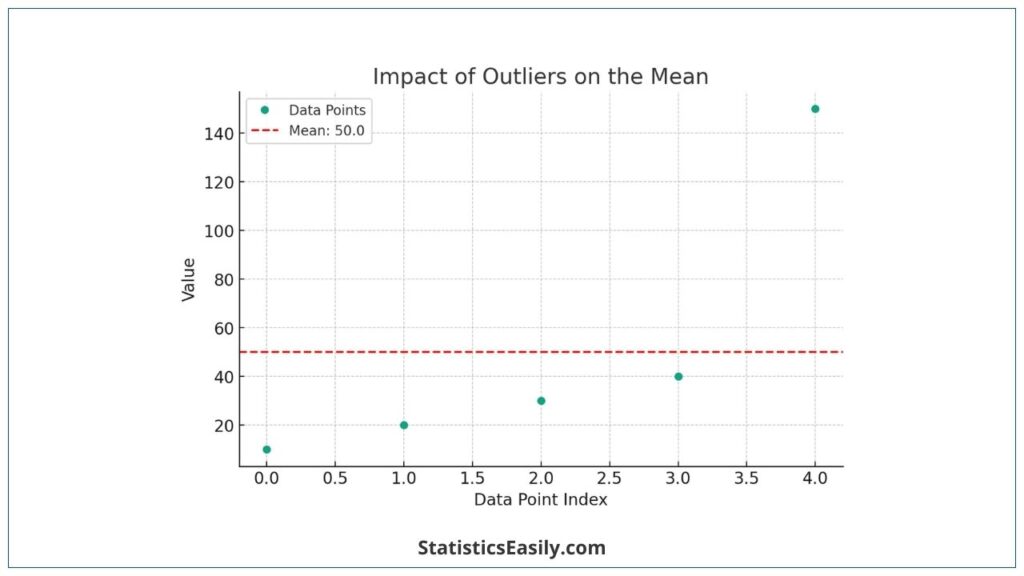
Consider a dataset: 10,20,30,40,150. The mean of this dataset is 50, calculated as (10+20+30+40+150)/5. However, notice how the value 150 (an outlier) significantly influences the mean, making it higher than most data points in the set.
To visually represent the effect of outliers on the mean, let’s create a graph that includes this dataset, highlighting the mean and the impact of the outlier.
Median
The median is a robust measure of central tendency, representing the middle value in a sorted dataset. It is calculated by arranging all values from the lowest to the highest and finding the central number. The median is the middle value in a dataset with an odd number of values. For even-numbered datasets, it is the average of the two middle values. Mathematically, if n is odd, the median is the (n+1)/2th value. If n is even, it is the average of the 2n/2th and (n/2)+1th values.
Applications and Use Cases of the Median
The median is particularly useful in skewed distributions or datasets with outliers. Unlike the mean, it is not affected by extremely high or low values, making it a more representative measure of central tendency in such cases. This characteristic makes the median highly applicable in fields like real estate, income analysis, and any scenario where outliers are common and can skew the data.
Examples and Visual Aids
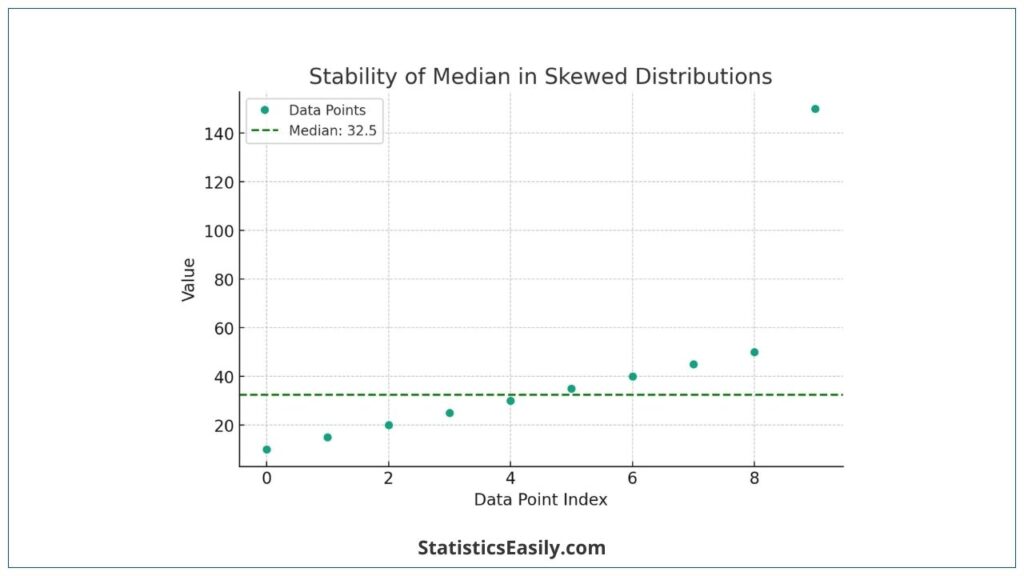
Consider a dataset: 10,20,30,40,150. The median of this dataset is 30, which is the middle value when the data is sorted. The high value 150 does not affect the median as it does the mean.
To illustrate the median’s utility in skewed distributions, let’s create a graph representing this concept with a dataset that includes outliers. This visual representation will demonstrate how the median remains stable even in extreme values.
Mode
The mode is the value that appears most frequently in a dataset. Unlike mean and median, the mode is not necessarily unique, leading to datasets that can be unimodal (one mode), bimodal (two modes), or multimodal (more than two modes). Calculating the mode involves identifying the frequency of each value in the dataset and determining which value(s) occur most often.
Applications and Limitations of the Mode
The mode is handy in analyzing categorical data where numerical averages may not be meaningful, such as determining the most preferred brand in a consumer survey. It is also valuable in identifying trends or commonalities within datasets, such as the most common symptoms in a medical study or the most occurring sales item in a store.
However, the mode’s utility is limited by its dependence on the frequency of values. The mode may not be informative in datasets where values are uniformly distributed or where each value occurs with a similar frequency. Additionally, in continuous numerical data, the concept of mode becomes less clear since the probability of two values being the same is low.
Examples and Visual Aids
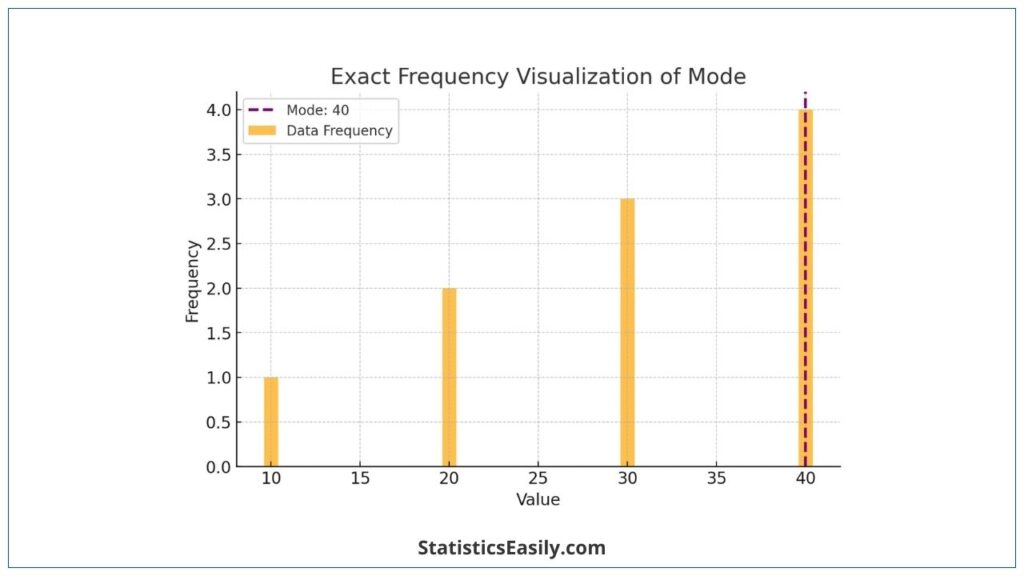
Consider a dataset: 10,20,20,30,40. The mode of this dataset is 20, as it appears more frequently than any other value.
To illustrate the concept of mode, let’s create a graph representing a dataset with a modal distribution. This will help visualize how the mode can indicate the most common values in a dataset.
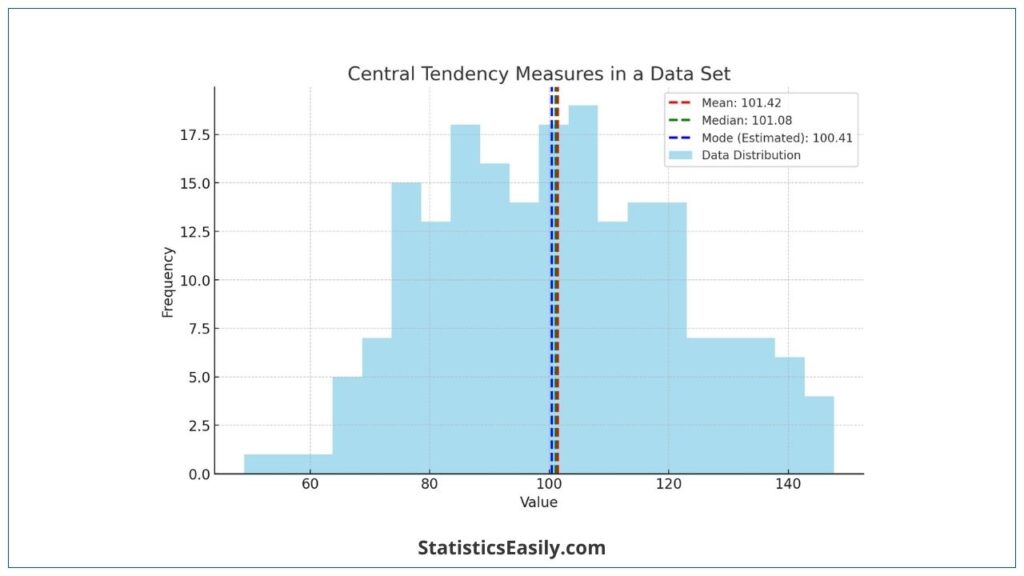
Comparative Analysis
Understanding the differences and appropriate applications of mean, median, and mode is crucial in statistical analysis. Each measure of central tendency has unique characteristics that make it suitable for specific scenarios. Let’s compare these measures using various datasets to highlight their differences and use cases.
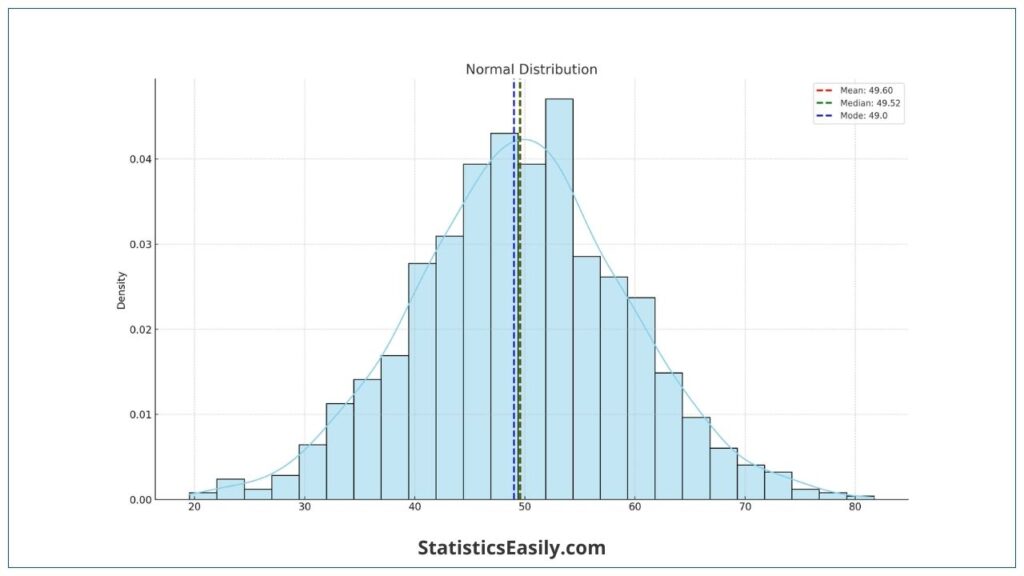
Normal Distribution:
- Mean: Effectively represents the central tendency as data is symmetrically distributed.
- Median: Aligns closely with the mean in a normal distribution.
- Mode: Typically coincides with the mean and median in a perfectly normal distribution.
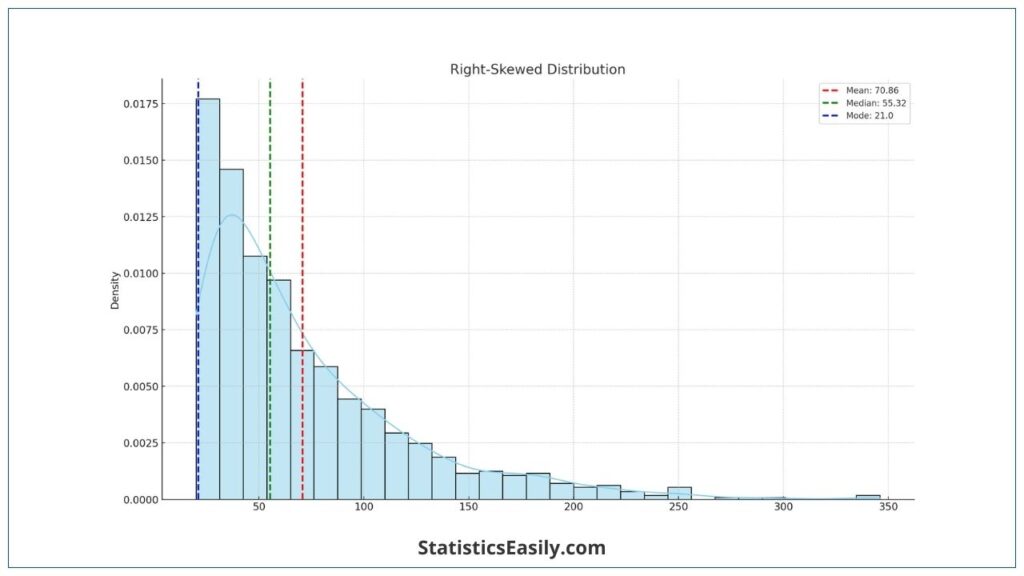
Skewed Distribution (Right-Skewed):
- Mean: Higher than median and mode due to the influence of outliers on the right.
- Median: More representative of the dataset’s central tendency than the mean.
- Mode: Least affected by outliers, indicating the most frequent value.
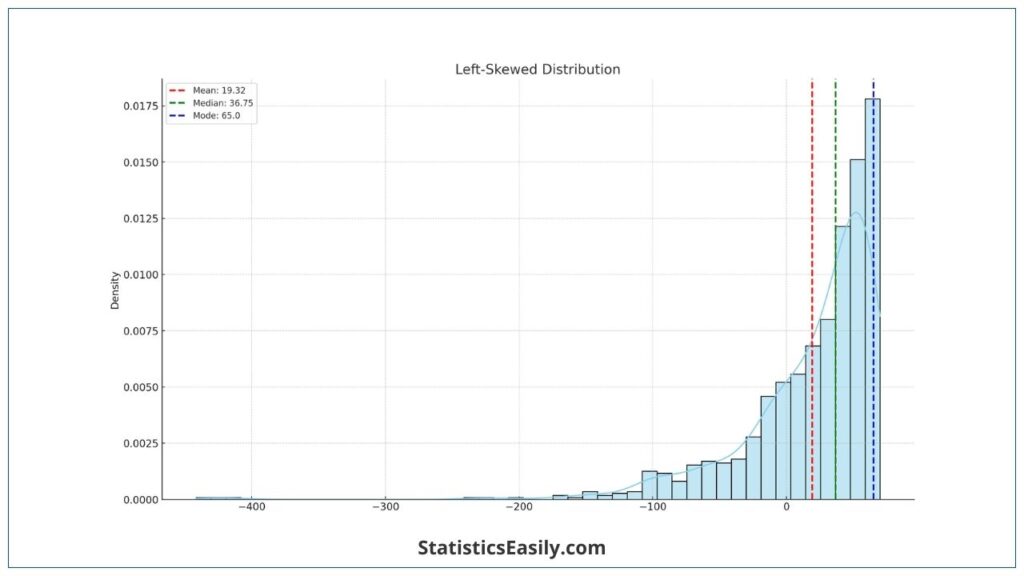
Skewed Distribution (Left-Skewed):
- Mean: Lower than both median and mode, influenced by low-value outliers.
- Median: Provides a better central value than the mean.
- Mode: Represents the most common value in the dataset.
Bimodal Distribution:
- Mean: Provides an average that may not represent any typical value.
- Median: Offers a middle value but may not indicate the frequency of occurrence.
- Mode: Highlights the two most frequent values, helpful in identifying multiple peaks.
Let’s create a table summarizing these scenarios and representative graphs for each distribution for visual comparison.
| Distribution Type | Mean | Median | Mode |
|---|---|---|---|
| Normal Distribution | Centrally located | Close to mean | Same as mean and median |
| Right-Skewed Distribution | Higher than median and mode | More representative than mean | Least affected by outliers |
| Left-Skewed Distribution | Lower than median and mode | More representative than mean | Least affected by outliers |
| Bimodal Distribution | Average, may not represent typical values | Middle value, may not indicate frequency | Indicates two most frequent values |
Advanced Considerations
Skewed Distributions:
Skewed distributions occur when data points are not symmetrically distributed around the mean, resulting in a dataset that is either right-skewed (positively skewed) or left-skewed (negatively skewed). In such distributions, the mean is pulled towards the tail and is no longer a reliable central point.
Right-Skewed Distribution: The mean is often greater than the median due to the pull of high-value outliers. For example, the mean can be misleadingly higher than the median in income data, where a few individuals have significantly higher incomes.
Left-Skewed Distribution: Conversely, the mean is less than the median in left-skewed distributions, influenced by low-value outliers. An example can be found in age distributions in specific populations where a higher concentration of younger individuals can skew the mean age downwards.
Impact of Outliers:
Outliers are data points significantly different from the rest of the data. They can drastically affect the mean, as it incorporates all data points into its calculation.
Effect on Mean: In the presence of outliers, the mean can become an unrepresentative measure of central tendency. For instance, in a dataset of house prices, a few extremely high-priced houses can significantly increase the mean, providing an inaccurate picture of the typical house price.
Stability of Median and Mode: The median, being the middle value, is less affected by outliers and often provides a more accurate representation of central tendency in skewed distributions. As the most frequent value, the mode remains unaffected by outliers. It can offer insights into the most common occurrence in the data.
Practical Applications
Below are real-world examples and case studies demonstrating how these measures are effectively used:
Mean in Economics and Finance:
- In economics, the mean is used to calculate the average income or expenditure of populations, which is crucial for policy-making and economic planning.
- In finance, the mean return of investment portfolios is analyzed to assess performance and make investment decisions.
Median in Real Estate and Sociology:
- The median house price is a commonly reported statistic in real estate. It provides a more accurate representation of the housing market than the mean, which can be skewed by extremely high or low values.
- Sociologists use the median to study income distribution within societies, as it gives a clearer picture of the middle-income bracket, especially in cases of income inequality.
Mode in Market Research and Retail:
- Market researchers use the mode to identify consumers’ most popular product features or preferences, guiding product development and marketing strategies.
- Retailers analyze sales data to determine the most frequently purchased items, using the mode to stock products effectively and plan promotions.
Case Study: Health and Medicine:
- In medical research, the mean blood pressure level of a population might be studied to understand overall health trends. However, in cases with outliers (extremely high or low values), the median can provide a more representative measure of central blood pressure trends.
- Epidemiologists often use the mode to identify a disease’s most common symptoms or characteristics, which can be critical in diagnosing and understanding the spread of illnesses.
Historical Data Analysis:
- Historians and researchers might use these measures to analyze trends, such as the mean income level during different historical periods or the median age of populations in various eras.
In each of these applications, the choice of mean, median, or mode depends on the nature of the data and the specific insights sought.
Ad Title
Ad description. Lorem ipsum dolor sit amet, consectetur adipiscing elit.
Conclusion
While commonly used for its simplicity, the mean has limitations, especially in the presence of outliers or skewed distributions. In such scenarios, the mean may not accurately represent the central tendency, as it is influenced by every value in the dataset, including the extreme ones.
With its resilience to outliers, the median often emerges as a more representative measure of central tendency, particularly in skewed distributions. It provides a more balanced central point by dividing a dataset into two halves, irrespective of extreme values.
The mode, essential in categorical data analysis, illuminates the most frequently occurring value in a dataset. It is beneficial in identifying trends and commonalities within the data. However, its effectiveness may be limited in uniformly distributed datasets.
These measures have practical applications in a wide range of fields, from economics and finance to real estate and medicine. They aid in policy-making, investment decisions, market analysis, and much more, proving their indispensable role in various domains.
Recommended Articles
Discover more insights and in-depth analysis on statistical concepts by exploring related articles on our blog.
- Which is Better, Mean or Median?
- Defining the Mean in Simple Terms!
- How to Calculate the Median in Excel
Frequently Asked Questions (FAQs)
Q1: What is Central Tendency? Central tendency refers to the measure representing a dataset’s center or typical value.
Q2: How Do Mean, Median, and Mode Differ? These measures differ in calculating the central value, each offering unique insights.
Q3: Why is the Mean Sensitive to Outliers? The mean considers all data points, making it susceptible to extreme values.
Q4: In What Situation Is the Median Preferred? The median is preferred in skewed distributions where outliers can distort the mean.
Q5: What is the Significance of Mode in Data Analysis? Mode highlights the most frequently occurring data point, which is helpful in categorical analysis.
Q6: Can a Dataset Have More Than One Mode? Yes, datasets can be bimodal or multimodal, having multiple modes.
Q7: How Does Skewness Affect Central Tendency Measures? Skewness can make mean unrepresentative, often making median a better choice.
Q8: Why is Understanding Central Tendency Important? It’s crucial for summarizing data and making informed decisions in analysis.
Q9: Can Central Tendency Measures be Misleading? Yes, these measures can be deceptive without considering data distribution and outliers.
Q10: Where Can I Learn More About These Concepts? Our blog and recommended readings offer deeper insights into these statistical measures.