Exploring Right-Skewed Histograms in Data Analysis
You will learn: Mastering the Interpretation of Right-Skewed Histograms for Enhanced Data Analysis.
Introduction
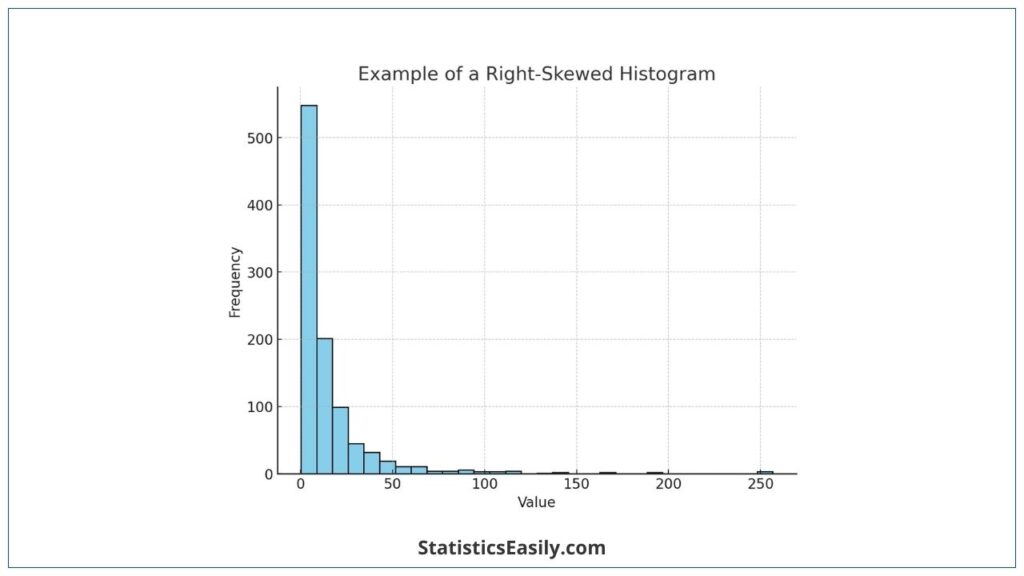
Histograms are a fundamental tool for visualizing and interpreting data distributions in data analysis. Particularly, right-skewed histograms represent a unique category of data distribution that demands careful analysis and understanding. A histogram is skewed right when its tail extends towards the right side, indicating a concentration of data values at the lower end of the scale. This pattern is often referred to as positive skewness. In such histograms, most observations are clustered towards the left, with fewer observations trailing off to the right.
The term “histogram skewed right” is not just a statistical jargon but a gateway to comprehending how data behaves in various scenarios. These histograms are pivotal in fields where the data is not symmetrically distributed, and understanding them is crucial for accurately interpreting the dataset. Right-skewed histograms can profoundly impact decision-making processes in various domains, making it essential for analysts and researchers to correctly recognize and interpret this skewness.
Highlights
- Right-skewed histograms often indicate a majority of data clustered towards the lower end.
- Outliers in data can significantly influence the skewness towards the right.
- Analyzing right-skewed data is vital in finance and environmental science.
- Transformation methods can normalize right-skewed data for better analysis.
- Understanding skewness is crucial for accurate data interpretation and decision-making.
Ad Title
Ad description. Lorem ipsum dolor sit amet, consectetur adipiscing elit.
The Significance of Right-Skewed Histograms
Understanding right-skewed histograms is pivotal in data analysis for several reasons. First and foremost, these histograms reveal a distribution where most data points are clustered towards the lower end of the scale. At the same time, a smaller number of higher values stretch the tail to the right. This pattern is a statistical anomaly and a reflection of real-world phenomena.
In practical scenarios, such as financial analysis or environmental studies, recognizing a right-skewed distribution can be the key to accurate interpretation. For example, most individuals fall into lower income brackets in income distribution, while a few high earners extend the tail. Similarly, environmental data like rainfall or pollution levels often display right-skewed patterns, where extreme values can have significant implications.
Moreover, right-skewness challenges the assumption of normality that many statistical methods rely on. This skewness can affect the calculation of mean and median, leading to potential biases in data analysis if not appropriately addressed. Analysts must identify and adjust for this skewness to avoid misleading conclusions.
In the realm of predictive modeling, histograms skewed right offer valuable insights. They help identify outliers and understand their impact on the overall data set. This is crucial in developing robust models that accurately reflect the underlying data distribution.
Identifying Right-Skewed Histograms
Identifying right-skewed histograms is a critical skill in data analysis, requiring a clear understanding of their distinct characteristics. A histogram is considered right-skewed or positively skewed when it shows a long tail on the right side of the distribution. This skewness indicates that while most data points are gathered towards the left side of the histogram (representing the lower values), a few significantly higher values stretch the tail towards the right.
To accurately identify a right-skewed histogram, look for these features:
- Concentration of Data: Most data points are clustered at the lower end of the scale, creating a peak towards the histogram’s left.
- Long Tail: The tail of the histogram extends to the right, indicating the presence of outliers or highly high values in the dataset.
- Asymmetry: Unlike a normal distribution, which is symmetric, a right-skewed histogram is asymmetric, with an apparent deviation towards the right.
It’s also important to note that statistical measures like the mean, median, and mode follow a specific order in right-skewed data. Typically, the mean is greater than the median, which is, in turn, greater than the mode. This is due to the influence of high-value outliers pulling the mean to the right.
Interpreting Right-Skewed Data
Interpreting data from right-skewed histograms is a nuanced process that goes beyond mere observation of the shape of the distribution. It involves understanding the implications of the data’s asymmetry and how it affects statistical analysis and decision-making. In right-skewed data, the tail of the distribution extends towards higher values, indicating that a minority of higher values are pulling the distribution to the right.
Here are vital aspects to consider when interpreting right-skewed data:
- Impact on Central Tendencies: In right-skewed data, the mean is often higher than the median due to the influence of high-value outliers. Relying solely on the mean for central tendency can lead to misinterpretation.
- Understanding Outliers: The long tail towards the right in a right-skewed histogram suggests the presence of outliers. Identifying whether these outliers are genuine data points or result from data entry errors is crucial.
- Practical Implications: In real-world scenarios, right-skewed data can have significant implications. For instance, in income distribution, a right-skewed histogram indicates many people with lower incomes and a small number with exceptionally high incomes. This has profound socio-economic implications.
- Decision Making: When dealing with right-skewed data, especially in fields like finance or environmental science, it’s essential to consider the skewness in the decision-making process. For example, understanding the skewness in risk assessment or resource allocation can lead to more informed and effective strategies.
- Transforming Data: Sometimes, it might be necessary to transform right-skewed data to approximate a normal distribution, especially for statistical models that assume normality. Techniques like logarithmic transformation can be used to minimize the impact of extreme values.
Ad Title
Ad description. Lorem ipsum dolor sit amet, consectetur adipiscing elit.
Case Studies: Right-Skewed Histograms
Real-world examples provide invaluable insights into the practical applications of right-skewed histograms. These histograms are theoretical constructs and tools that mirror the asymmetry often found in real-world data. Understanding how they apply in various scenarios is critical to grasping their importance in data analysis.
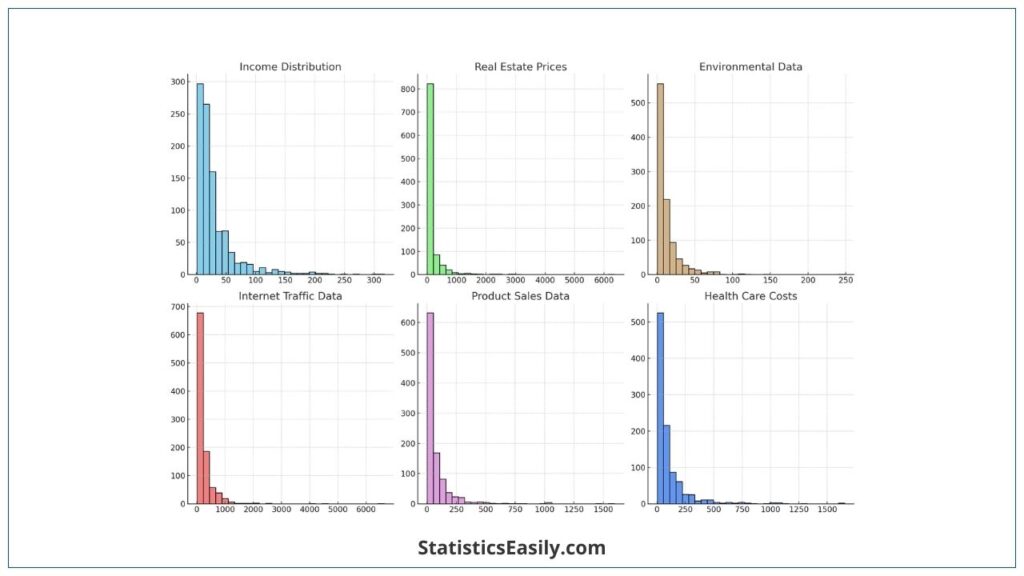
1. Income Distribution: A classic example of right-skewed data is income distribution. In many societies, a large portion of the population earns below the average national income. In contrast, a small number of individuals earn significantly more, creating a long tail on the right side of the histogram. This skewness is crucial for policymakers in designing equitable tax systems and social welfare programs.
2. Real Estate Prices: Property values in a city or region often display right-skewed characteristics. Most properties might be valued within a specific range. Still, luxury homes and estates can significantly exceed these values, pulling the distribution to the right. Understanding this skewness is vital for real estate investors, urban planners, and policymakers.
3. Environmental Data: Environmental studies frequently encounter right-skewed data. Consider air quality indices; most days might have moderate pollution levels, but a few days might experience extremely high pollution due to specific events, like wildfires. This right skewness helps environmentalists and health officials in planning and issuing warnings.
4. Internet Traffic Data: Websites often experience right-skewed visitation patterns. A few pages might attract a disproportionately high amount of traffic, while the majority have modest visitation numbers. This insight is crucial for digital marketers and content creators.
5. Product Sales Data: Sales data in retail often show right-skewed distribution, where a few products (like seasonal or trendy items) may have exceptionally high sales. In contrast, most products have moderate to low sales. This skewness guides inventory management and marketing strategies.
6. Health Care Costs: Health care expenditure often exhibits a right-skewed distribution. In many healthcare systems, most patients incur relatively low medical expenses. However, a smaller subset of patients with severe or chronic conditions can generate extraordinarily high costs. This pattern results in a long tail to the histogram’s right, indicating the presence of these high-cost cases. Such skewness is crucial for healthcare administrators and policymakers in resource allocation, insurance premium settings, and understanding the dynamics of healthcare funding. This understanding aids in creating more efficient and equitable healthcare systems.
Conclusion
In exploring right-skewed histograms in data analysis, we’ve uncovered their profound significance and practical applications. Right-skewed histograms are not mere statistical constructs but reflect many real-world scenarios. The importance of recognizing and accurately interpreting these distributions cannot be overstated, as they play a critical role in various domains.
Key takeaways include:
- The impact of right-skewness on measures of central tendency.
- The importance of outliers.
- The practical implications in diverse fields.
We’ve also emphasized the necessity of transforming data for more accurate statistical modeling and the role of right-skewed histograms in predictive analytics.
Recommended Articles
Discover more in-depth articles on histograms and data analysis by visiting our blog. Expand your understanding and expertise today!
- Exploring Histogram Shapes: A Guide
- How To Select The Appropriate Graph?
- Left-Skewed and Right-Skewed Distributions
Frequently Asked Questions (FAQs)
Q1: What defines a right-skewed histogram? It’s characterized by a longer tail on the right side, indicating that the data has more extreme values on the higher end.
Q2: Why is understanding right-skewed histograms important in data analysis? They are crucial for accurate data interpretation, especially in fields with asymmetric data distributions.
Q3: How does right-skewness affect the mean and median? In a right-skewed histogram, the mean is typically greater than the median due to high-value outliers.
Q4: Can right-skewed data be normalized? Yes, using transformation techniques like logarithmic scaling can help normalize skewed data.
Q5: What are typical examples of right-skewed data? Income distribution and real estate prices often display right-skewed characteristics.
Q6: How does right-skewness impact statistical modeling? Right-skewness can lead to biased estimates in models that assume normality, requiring adjustments.
Q7: Are there tools to measure skewness in histograms? Yes, statistical software often includes skewness coefficient calculations to quantify data asymmetry.
Q8: Can right-skewed histograms be used in predictive analytics? Yes, they provide valuable insights for predictions, especially in financial and economic forecasting.
Q9: What challenges arise in analyzing right-skewed data? Challenges include dealing with outliers and applying appropriate transformation methods for analysis.
Q10: How does skewness relate to data quality? Understanding skewness helps identify data quality issues, such as sampling or entry errors.