Statistics is the Grammar of Science
You will learn why Statistics is the Grammar of Science — fundamental to scientific discovery and innovation.
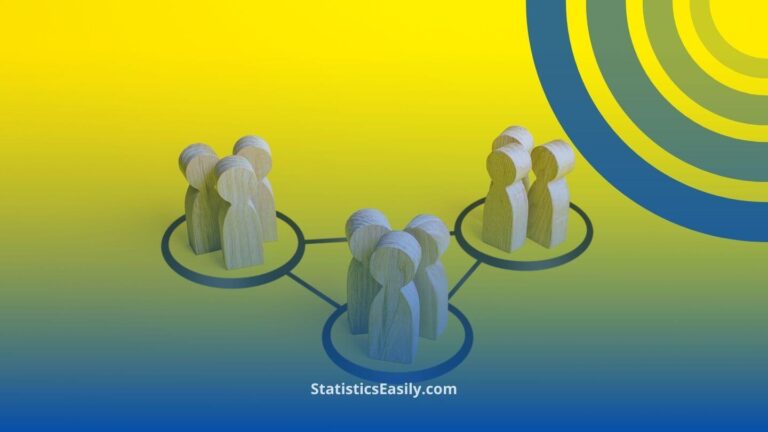
Introduction
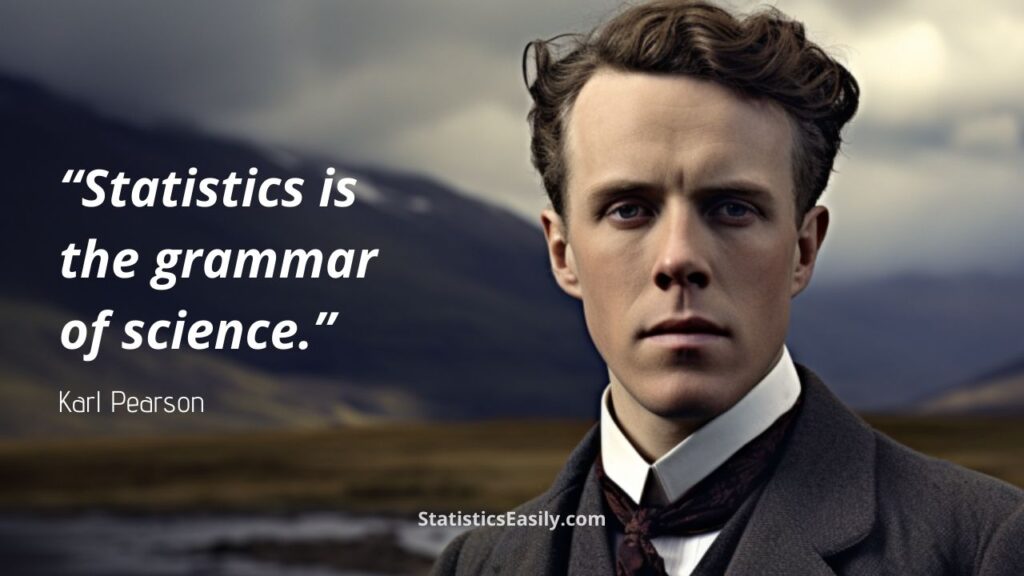
The assertion that “statistics is the grammar of science” finds its roots in the words of Karl Pearson, a pioneering figure in the field of statistics. This analogy eloquently captures the essence of statistics as the foundational framework that governs the organization, analysis, and interpretation of data in scientific endeavors. Just as grammar provides the structure and rules essential for the coherence and clarity of language, statistics offers the methodologies and principles vital for deciphering the complex language of scientific data.
Understanding the pivotal role of statistics in scientific research and data analysis is crucial. It serves as the cornerstone of empirical study, facilitating the design of experiments, the robust analysis of data, and the objective interpretation of results. By applying statistical principles, scientists can quantify uncertainty, validate hypotheses, and derive meaningful conclusions from empirical evidence. In the contemporary landscape of science, where data is voluminous and multifaceted, the significance of statistics in extracting insights and forwarding scientific knowledge is unparalleled.
This article pays homage to Karl Pearson’s profound insight, exploring the indispensable role of statistics in the scientific method. We will journey through the foundational statistical concepts every scientist must grasp, from descriptive measures like mean, median, and mode to inferential techniques such as hypothesis testing and regression analysis. Through this exploration, we aim to illuminate how statistical methods underlie and propel the scientific quest for knowledge, driving discoveries that extend the boundaries of our understanding of the natural world.
Highlights
- Statistics enables the quantification of scientific uncertainty.
- Hypothesis testing is a cornerstone of scientific research.
- Regression analysis predicts outcomes based on data trends.
- Statistical significance is crucial for validating scientific results.
- Data visualization aids in the interpretation of complex datasets.
Ad Title
Ad description. Lorem ipsum dolor sit amet, consectetur adipiscing elit.
Karl Pearson: The Father of Modern Statistics
Karl Pearson stands as a monumental figure in the annals of science, particularly in statistics. His work laid the groundwork for modern statistical theory, transforming statistics from a tool of convenience into a rigorous scientific discipline with wide-ranging applications. Pearson’s contributions were not merely academic but revolutionary, setting the stage for countless advancements in various scientific fields.
Pioneering Contributions
Pearson’s legacy is vast, but among his most notable contributions is the development of the Pearson correlation coefficient. This measure quantifies the strength and direction of the relationship between two variables. This was a groundbreaking advancement, providing a mathematical basis for the concepts of correlation and regression that are pivotal in data analysis today.
Advancing Statistical Methods
Beyond correlation, Pearson was instrumental in advancing the method of moments for the estimation of population parameters and in laying the foundations for the chi-squared test, which is widely used for hypothesis testing in categorical data. His work on the theory of distributions, including the Pearson distribution system, has been fundamental in understanding the variability and behavior of data in different contexts.
Legacy and Impact
Karl Pearson’s influence extends beyond the realm of statistics. He was a crucial figure in the biometry movement, applying statistical methods to biological problems and contributing to developing fields such as genetics and evolutionary biology. His interdisciplinary approach showcased the versatility of statistical methods and their applicability across various domains of scientific inquiry.
Pearson’s vision for statistics as a distinct scientific discipline was realized by establishing the world’s first university statistics department at University College London. His efforts in education and research have perpetuated a legacy of statistical excellence and innovation.
A Complex Legacy
While Pearson’s contributions to statistics and science are undeniable, it is also essential to acknowledge the complexities of his legacy, particularly his advocacy for eugenics. These aspects of his work have sparked controversy and debate, underscoring the need for ethical considerations in scientific research and the application of statistical methods.
The Role of Statistics in Science
Statistics is critical in formulating scientific theories and has been instrumental in numerous scientific breakthroughs throughout history. This section delves into how statistical methods contribute to the development of scientific knowledge and highlights critical historical instances where statistics have paved the way for significant advancements.
Formulating Scientific Theories
Statistical analysis is fundamental in testing and formulating scientific theories. By providing a framework for designing experiments, collecting data, and analyzing results, statistics help scientists validate or refute hypotheses with a quantifiable confidence level. For instance, statistical tests, such as the t-test or ANOVA, allow researchers to assess the likelihood that observed differences in experimental outcomes are not due to random chance. This uncertainty quantification is crucial in building robust scientific theories that can be reliably applied in various contexts.
Historical Examples of Statistical Breakthroughs
These examples underscore the indispensable role of statistics in advancing scientific knowledge. By providing the tools to test hypotheses and interpret complex data rigorously, statistics continues to be the grammar through which the language of science is articulated and understood.
Mendelian Genetics: Gregor Mendel’s work on pea plants in the 19th century laid the foundation for genetics. Mendel’s statistical analysis of inheritance patterns revealed the fundamental laws of genetic inheritance, transforming biology and medicine.
The Discovery of the Electron: J.J. Thomson’s experiments at the end of the 19th century, which led to the discovery of the electron, were underpinned by meticulous statistical analysis. By measuring the deflections of cathode rays under magnetic and electric fields, Thomson could infer the presence of a particle much smaller than the atom.
Penicillin and Randomized Controlled Trials: Randomized controlled trials (RCTs) significantly advanced the development of penicillin and its subsequent validation as an effective antibiotic. This statistical method allowed researchers to unequivocally demonstrate the drug’s efficacy, setting a new standard for clinical research.
The Higgs Boson Discovery: The confirmation of the Higgs boson’s existence by the Large Hadron Collider (LHC) at CERN in 2012 was a monumental achievement in physics, heavily reliant on statistical analysis. The detection of particles in the data that fit the expected profile of the Higgs boson was made possible by sophisticated statistical models designed to sift through billions of particle collisions.
Human Genome Project: The mapping and sequencing of the human genome, completed in the early 21st century, required extensive statistical analysis to assemble and interpret the vast amounts of genetic data. This project has revolutionized our understanding of human biology and disease.
Basic Statistical Concepts Every Scientist Should Know
A foundational understanding of certain statistical concepts is indispensable in pursuing scientific knowledge. This section highlights two primary statistics areas crucial for every scientist: descriptive and inferential statistics. These concepts aid in the analysis and interpretation of data and in communicating research findings.
Descriptive Statistics: Mean, Median, Mode
Descriptive statistics provide a way to summarize and describe the main features of a dataset. Three fundamental measures are central to this:
Mean: The average value of a dataset is calculated by summing all observations and dividing by the number of observations. The mean offers a quick snapshot of the data’s central tendency. Still, it can be influenced by extreme values or outliers.
Median: The middle value when the observations are ordered from smallest to largest. The median is particularly useful in providing a more robust measure of central tendency in skewed distributions where outliers may distort the mean.
Mode: The most frequently occurring value in a dataset. In datasets with a high number of repeated values, the mode can provide insight into the most common or popular values.
Understanding these measures is crucial for summarizing large volumes of data, allowing scientists to convey complex information succinctly and effectively.
Inferential Statistics: Hypothesis Testing, Confidence Intervals
Inferential statistics extend beyond the data, offering methods to make predictions or inferences about a population based on a sample.
Hypothesis Testing: A statistical method that allows scientists to test assumptions or theories about a population parameter. Hypothesis testing is foundational in scientific research, providing a structured framework to determine the probability that an observed effect is due to chance. The outcome of a hypothesis test is usually articulated in terms of a p-value, which quantifies the strength of the evidence against the null hypothesis.
Confidence Intervals: A range of values derived from the sample data likely to contain the value of an unknown population parameter. Confidence intervals provide an estimate of this value and the uncertainty associated with the estimate. For instance, a 95% confidence interval suggests that if the same population is sampled multiple times, approximately 95% of the confidence intervals calculated from those samples will contain the true population parameter.
Both hypothesis testing and confidence intervals are pivotal in interpreting experimental data. They allow scientists to assess the reliability of their findings and make informed decisions based on statistical evidence.
Visualization
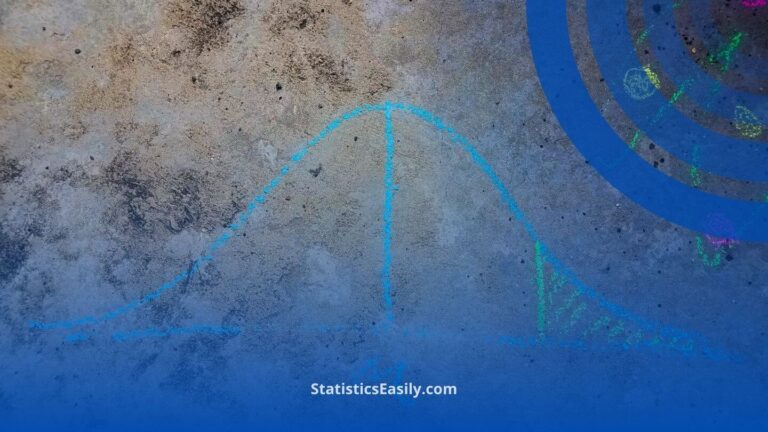
To complement the understanding of these concepts, visual aids such as graphs and charts can be invaluable. For instance, a histogram can visually represent the distribution of data, helping to identify the data distribution’s central tendency, dispersion, and shape. Similarly, box plots can offer insights into the spread of the data and the presence of outliers, enhancing the interpretability of descriptive statistics.
Incorporating these basic statistical concepts into scientific research strengthens the analysis and enhances the credibility and reliability of the findings. As the grammar of science, statistics empowers scientists to articulate the narratives hidden within their data, paving the way for new discoveries and advancements in their respective fields.
Statistics in Practice: Real-World Applications
The application of statistics extends far beyond theoretical constructs, playing a pivotal role in various scientific fields. Through the lens of case studies, this section showcases the practical implications of statistical methodologies in real-world scenarios, underscoring the versatility and indispensability of statistical analysis in scientific research.
Public Health: Tracking and Controlling Epidemics
In public health, statistics is a crucial tool for tracking disease spread and evaluating interventions’ effectiveness. For instance, during the COVID-19 pandemic, statistical models were employed to predict the trajectory of the virus, informing public health policies and resource allocation. Epidemiologists could identify hotspots, forecast healthcare needs, and recommend preventive measures to control the spread by analyzing data on infection rates, recovery rates, and mortality.
Genetics: Understanding Hereditary Diseases
Statistics is fundamental in genetics, particularly in the study of hereditary diseases. By employing statistical methods to analyze genetic data, researchers can identify patterns of inheritance and pinpoint genetic markers associated with specific conditions. For example, association studies have enabled scientists to discover genetic variations linked to diseases such as cancer, diabetes, and heart disease, paving the way for personalized medicine and targeted therapies.
Astrophysics: Exploring the Universe
In astrophysics, statistical analysis is essential for interpreting data from telescopes and space missions. The vast and complex datasets require sophisticated statistical methods to extract meaningful information. For example, statistical techniques have been used to map galaxies’ distribution, estimate the universe’s age, and detect exoplanets orbiting distant stars. These insights have significantly advanced our understanding of the cosmos and the fundamental laws governing it.
Economics: Forecasting Market Trends
Statistics also finds extensive application in economics, where it is used to analyze and forecast market trends. By examining historical data, economists employ statistical models to predict future economic conditions, such as inflation rates, employment levels, and GDP growth. These forecasts are crucial in policy-making, investment decisions, and strategic planning for governments and businesses.
Overcoming Common Statistical Challenges
Researchers often encounter various statistical challenges in scientific inquiry, where statistics is foundational. Addressing these challenges is crucial for ensuring the integrity and reliability of scientific findings. This section outlines common statistical pitfalls and guides how to navigate them effectively.
Misinterpretation of Results
One of the most prevalent issues in statistical analysis is the misinterpretation of results, particularly p-values and confidence intervals. A p-value, while indicating the probability of observing the data if the null hypothesis were true, does not directly measure the probability that the hypothesis is correct. Similarly, confidence intervals are often misunderstood as the range within which the true parameter value lies with a certain probability rather than a range of plausible values based on the sample data.
Solution: Enhance statistical literacy by providing clear explanations and interpretations of statistical measures in the study context. Emphasize the implications of the findings rather than just the numerical results.
Overreliance on Statistical Significance
The exclusive focus on statistical significance (often denoted by a p-value threshold of 0.05) can lead to overlooking practical significance. Statistically significant findings are not necessarily meaningful in a real-world context, especially if the effect size is small.
Solution: Alongside statistical significance, report and discuss the effect size and its practical implications. This approach provides a more nuanced understanding of the study’s impact.
Data Dredging
Data dredging, or p-hacking, involves extensive searching through data to find significant relationships without a prior hypothesis. This practice increases the risk of Type I errors (false positives), where random patterns are mistaken for meaningful findings.
Solution: Predetermine the hypotheses and analysis plans before examining the data. When the exploratory analysis is necessary, clearly label it as such and use it to generate rather than test hypotheses.
Sampling Bias
Sampling bias occurs when the sample does not represent the population, leading to skewed results and conclusions that do not generalize well.
Solution: Employ rigorous sampling methods that ensure the sample’s representativeness. When random sampling is not feasible, acknowledge the potential biases and limitations in interpreting the results.
Overfitting Models
To achieve the best fit for the data, there’s a risk of overfitting statistical models, especially in complex analyses like regression. Overfitted models perform well on the sample data but poorly on new data, as they capture noise rather than the underlying pattern.
Solution: Use techniques such as cross-validation to assess model performance on independent data sets. Opt for simpler models that provide comparable explanatory power to more complex ones.
Ignoring Model Assumptions
Many statistical tests and models have underlying assumptions, such as normality, independence, and homoscedasticity. Violating these assumptions can lead to invalid results.
Solution: Before applying any statistical test or model, check its assumptions using appropriate diagnostic tools or plots. If assumptions are violated, consider alternative methods or transformations that align with the data characteristics.
Navigating these common statistical challenges requires rigorous methodology, critical thinking, and a nuanced understanding of statistical principles. By fostering a culture of statistical competence and integrity, the scientific community can enhance the reliability and impact of its research, truly embodying the essence of statistics as the grammar of science.
Ad Title
Ad description. Lorem ipsum dolor sit amet, consectetur adipiscing elit.
Conclusion: Reflecting on the Grammar of Science
As we conclude our exploration of why statistics is aptly described as the grammar of science, we must revisit the key points illuminating its foundational role in scientific discovery and innovation. This article has journeyed through Karl Pearson’s profound insights, the pioneering contributions and advancements in statistical methods, and the real-world applications that underscore the versatility and indispensability of statistical analysis.
With its capacity to quantify uncertainty, validate hypotheses, and predict outcomes, statistics remains an indispensable tool in the scientific toolkit. The journey from the foundational concepts of mean, median, and mode to the more complex inferential techniques like hypothesis testing and confidence intervals showcases the depth and breadth of statistical application. These concepts aid in the rigorous data analysis and the clear and objective interpretation of results, ensuring the integrity of scientific findings.
The legacy of Karl Pearson and the subsequent advancements in statistical methods have paved the way for significant breakthroughs across various scientific fields. From public health and genetics to astrophysics and economics, the application of statistics has been pivotal in driving forward our understanding of the natural and social worlds. These applications highlight the ongoing relevance of statistics in addressing complex questions and solving real-world problems.
However, as we navigate the complexities of statistical analysis, the challenges such as misinterpretation of results, overreliance on statistical significance, and ethical considerations remind us of the need for rigorous methodology and critical thinking. Addressing these challenges is crucial for maintaining the integrity and reliability of scientific research.
In an era of increasingly voluminous and multifaceted data, the role of statistics in science continues to expand. Its fundamental principles remain as relevant today as they were in Pearson’s time, guiding new generations of scientists in their quest for knowledge. As we move forward, the grammar of science will continue to evolve, adapting to new challenges and opportunities. Still, its core mission remains unchanged: to bring clarity, precision, and understanding to the complex data language.
This reflection on statistics as the grammar of science reaffirms our commitment to pursuing truth, disseminating knowledge, and celebrating discoveries that enhance our understanding of the universe.
Recommended Articles
Explore more insights and deepen your understanding of statistics and data science by reading our related articles.
- The Hidden Truth: What They Never Told You About Statistics
- A Comprehensive Guide to Hypotheses Tests in Statistics
- Florence Nightingale: How Pie Charts Saved Lives
- Quotes On Statistics & Data Analysis
- How Statistics Can Change Your Life
Frequently Asked Questions (FAQs)
Q1: Why is Statistics called the grammar of science? It provides the foundational rules for understanding and interpreting data in scientific research.
Q2: How does statistics help in scientific research? It aids in designing experiments, analyzing data, and validating hypotheses.
Q3: What is hypothesis testing in statistics? It is a method for determining whether there is significant evidence to support a specific hypothesis.
Q4: What is the importance of statistical significance? It determines whether a study’s results are likely due to chance or a specific factor.
Q5: How can statistics mislead in scientific studies? Misuse or misunderstanding of statistical methods can lead to incorrect conclusions.
Q6: What is regression analysis in statistics? It is a technique for understanding the relationship between dependent and independent variables.
Q7: How do statistics support decision-making in science? They provide a quantitative basis for making informed decisions based on data.
Q8: Can statistics replace human judgment in science? While invaluable, they complement rather than replace expert interpretation and intuition.
Q9: What are the standard statistical software tools used in science? Tools like R, Python, and SPSS are widely used for statistical analysis.
Q10: How has the role of statistics evolved in modern science? With the advent of big data, its role has expanded, becoming more central to various scientific disciplines.