Student’s T-test in Data Analysis: A Comprehensive Exploration
You will learn the pivotal role of the Student’s t-test in insightful data interpretation and decision-making.
Introduction
One frequently encountered dilemma in the data analysis landscape is determining whether two data sets, perhaps from different interventions or conditions, significantly differ. The Student’s t-test, a cornerstone of statistical analysis, emerges as a solution in such scenarios. Originating from the work of William Sealy Gosset under the pseudonym ‘Student,’ this test has transcended its early 20th-century origins to become a fundamental tool in the data science toolkit.
The Student’s t-test compares the means of two groups, providing a quantitative basis for decision-making in fields as diverse as healthcare, education, and market research. Its application ranges from assessing the efficacy of new drugs to evaluating educational interventions, underscoring its significance in both theoretical and practical realms of statistical analysis.
This article aims to give readers a comprehensive understanding and practical guide to the Student’s t-test. From its historical context and mathematical foundations to its execution and interpretation in modern statistical software, we endeavor to equip you with the knowledge necessary to apply this test adeptly in your analytical pursuits. By demystifying the complexities of the Student’s t-test, we aspire to enhance your analytical rigor and contribute to the broader dissemination of robust, evidence-based conclusions in data analysis.
Highlights
- Student’s t-test differentiates between means from independent groups with precision.
- Assumption checks in Student’s t-tests enhance the reliability of your analysis.
- Real-world applications of Student t-tests span healthcare to market research.
- The step-by-step guide ensures accurate Student t-test execution in R and Python.
- Understanding effect size in Student’s t-tests reveals practical significance.
Ad Title
Ad description. Lorem ipsum dolor sit amet, consectetur adipiscing elit.
Understanding the Student’s t-test
At the heart of statistical analysis, the Student’s t-test is a crucial inferential tool designed to assess the significance of the difference between the means of two groups. This test assumes that data follow a normally distributed pattern, with independent observations and variances between groups equal or similar.
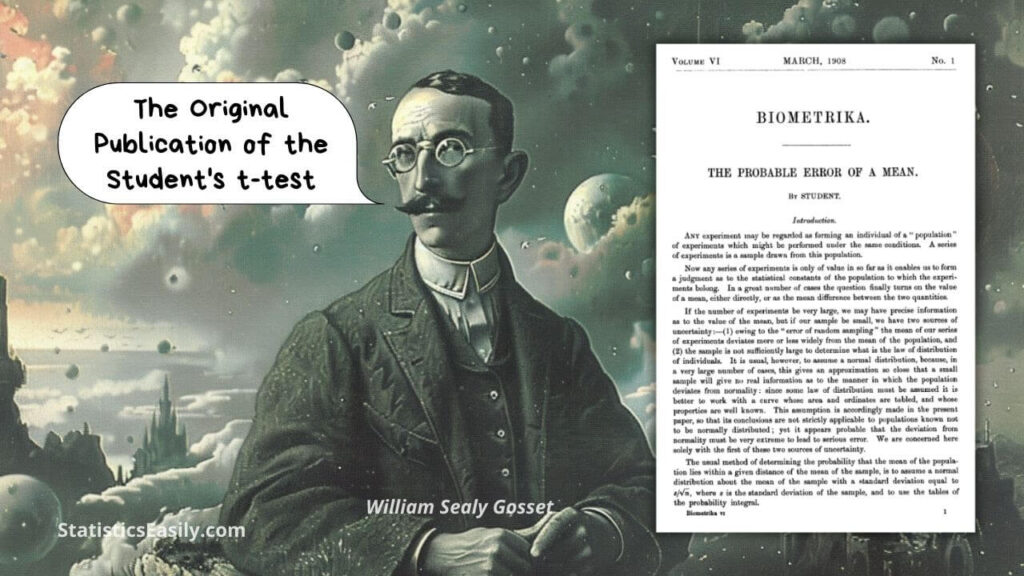
The inception of the Student’s t-test traces back to the early 20th century, attributed to the chemist and statistician William Sealy Gosset. Working for the Guinness Brewery, Gosset encountered the need for an efficient method to determine stout quality with small sample sizes. Due to contractual restrictions, he published his findings under the pseudonym “Student,” giving birth to the term “Student’s t-test.”
The mathematical foundation of the Student’s t-test revolves around the t-distribution. This probability distribution accounts for the sample size through degrees of freedom. The t-value, calculated from the difference in group means, sample size, and pooled variance, measures the distance between group means in standard error units. This value is then referenced against the t-distribution to ascertain the probability (p-value) of observing such a difference under the null hypothesis, which posits no difference between the means.
There are three primary variants of the Student’s t-test, each tailored to specific experimental designs:
Independent two-sample t-test: Used when comparing the means of two separate groups, such as a control group and an experimental group.
Paired t-test: Applies when comparing means from the same group at two different times or under two different conditions.
One-sample t-test: Tests the mean of a single group against a known mean.
Understanding these types and their respective assumptions is pivotal for appropriately applying the test, ensuring the validity and reliability of the inferential conclusions drawn from data analysis endeavors.
Applications of the Student’s t-test in Real-World Data Analysis
The Student’s t-test transcends theoretical statistics to find robust applications across diverse real-world scenarios, demonstrating its versatility and indispensability in data-driven decision-making. This section delves into practical applications of the t-test, showcasing its utility in healthcare, education, and business analytics through case studies and hypothetical examples.
Healthcare: In the healthcare sector, the Student’s t-test plays a crucial role in evaluating the efficacy of new treatments. Consider a clinical trial to assess a new medication’s effectiveness in lowering blood pressure. By comparing patients’ mean blood pressure readings before and after the medication regimen using a paired t-test, researchers can statistically ascertain the treatment’s impact, guiding critical decisions in patient care and treatment protocols.
Education: Educational research frequently employs the Student’s t-test to evaluate the outcomes of pedagogical interventions. For instance, an educational institution might implement a new teaching strategy in one class while maintaining traditional methods in another. Applying an independent t-test to compare students’ final exam scores between these classes can provide empirical evidence of the new strategy’s effectiveness, informing educational practices and policies.
Business Analytics: In business analytics, the Student’s t-test is instrumental in market research and product development. A company may launch a new advertising campaign in one region while keeping another region as a control. Using an independent t-test to compare sales figures before and after the campaign’s launch across these regions, the company can quantitatively evaluate the campaign’s impact on sales, optimizing marketing strategies and resource allocation.
These examples underscore the Student’s t-test as a fundamental tool for evidence-based decision-making across various fields. By enabling precise comparisons between groups, the t-test empowers professionals to draw data-driven conclusions, enhancing the effectiveness of interventions and strategies across numerous domains.
Step-by-Step Guide to Performing the Student’s t-test
This enhanced guide emphasizes thorough preparation, including testing assumptions and calculating effect sizes using specific R packages, to ensure the robust application of the Student’s t-test for both independent and paired samples.
Preparing Data and Testing Assumptions
I. For Independent t-test:
Download the dataset!
1. Load the Data:
independent_data <- read.csv("/path/to/student_t_test_dataset_independent.csv")
2. Test for Normality with Shapiro-Wilk test:
shapiro.test(independent_data$Group_C)
shapiro.test(independent_data$Group_D)
3. Test for Homogeneity of Variances with Levene’s test (using the ‘car’ package):
library(car)
leveneTest(Group_C ~ Group_D, data = independent_data)
4. Conduct the Independent t-test:
t_test_independent <- t.test(independent_data$Group_C, independent_data$Group_D, var.equal = TRUE)
print(t_test_independent)
5. Calculate Effect Size using the ‘effsize’ package for Cohen’s d:
library(effsize)
effect_size_independent <- cohen.d(independent_data$Group_C, independent_data$Group_D)
print(effect_size_independent)
II. For Paired t-test:
Download the dataset!
1. Load the Data:
paired_data <- read.csv("/path/to/student_t_test_dataset_paired.csv")
2. Test for Normality on the differences between pairs using Shapiro-Wilk test:
shapiro.test(paired_data$Group_A - paired_data$Group_B)
3. Conduct the Paired t-test:
t_test_paired <- t.test(paired_data$Group_A, paired_data$Group_B, paired = TRUE)
print(t_test_paired)
4. Calculate the Effect Size for the paired t-test using the ‘effsize’ package:
effect_size_paired <- cohen.d(paired_data$Group_A, paired_data$Group_B, paired = TRUE)
print(effect_size_paired)
Interpreting Results
Focus on the t-test output (t-value, df, p-value) and the effect size calculated by ‘cohen.d’ from the ‘effsize’ package. The p-value helps determine statistical significance, while the effect size offers insight into the magnitude of the difference, providing a more nuanced understanding of the test’s practical implications.
Incorporating dedicated packages for testing assumptions and calculating effect sizes enriches the analytical process, fostering a more nuanced and reliable application of the Student’s t-test in statistical analysis.
Common Pitfalls and How to Avoid Them
Conducting the Student’s t-test requires not only a grasp of statistical concepts but also an awareness of common pitfalls that can compromise the validity and reliability of the results. By understanding these pitfalls and adhering to best practices, you can ensure the integrity of your analysis and the credibility of your conclusions.
Common Pitfalls
1. Ignoring Assumptions: The t-test relies on certain assumptions, such as the normality of data and homogeneity of variances. Neglecting to test these assumptions can lead to inaccurate results.
2. Overlooking Sample Size: Small sample sizes may not adequately represent the population, leading to results that are not generalizable.
3. Misapplication of Test Types: Choosing the incorrect form of the t-test (independent, paired, or one-sample) for your data structure can invalidate your analysis.
4. Data Dredging: Conducting multiple t-tests on the same data set without adjusting for multiple comparisons increases the risk of Type I error (false positives).
5. Confusing Statistical Significance with Practical Significance: A statistically significant result does not always imply a result of practical importance.
Best Practices
1. Assumption Testing: Before performing the t-test, use the Shapiro-Wilk test for normality and Levene’s test for homogeneity of variances to validate the assumptions. For non-normal data, consider transformations or non-parametric alternatives.
2. Adequate Sample Size: Ensure your sample size is sufficient to detect a meaningful effect. Power analysis can be conducted beforehand to determine the required sample size.
3. Correct Test Selection: Choose the appropriate t-test variant based on your experimental design and data structure. Independent t-tests are for comparing two different groups, paired t-tests are for comparing the same group under two conditions, and one-sample t-tests are for comparing a single group against a known value.
4. Adjust for Multiple Comparisons: If conducting multiple t-tests, adjust your significance level using methods such as Bonferroni correction to control the family-wise error rate.
5. Report Effect Size: Alongside p-values, calculate and report the effect size (e.g., Cohen’s d) to provide insight into the magnitude of the difference, facilitating the interpretation of practical significance.
6. Transparent Reporting: Be clear about the t-test variant used, the assumptions checked, and any data transformations or corrections for multiple comparisons applied. This transparency enhances the reproducibility and reliability of your findings.
By avoiding these common mistakes and adhering to best practices, you can confidently conduct the Student’s t-test, contributing valuable insights to your field of study and advancing the pursuit of truth, goodness, and beauty in data analysis.
Beyond the Basics
Delving deeper into the Student’s t-test unveils a spectrum of advanced topics essential for a nuanced understanding and application of this statistical method. This section aims to broaden your analytical horizon, introducing effect size, power analysis, and alternative testing strategies for scenarios where standard t-test assumptions may not hold.
Effect Size
While the p-value from a t-test informs us about the statistical significance of our results, it does not convey the magnitude of the observed effect. Effect size metrics like Cohen’s d provide a standardized measure of the difference between two groups, offering insight into the practical significance of the findings. Cohen’s d is beneficial for comparing results across studies with different scales or units of measurement.
Power Analysis
Power analysis plays a pivotal role in the planning phase of an experiment, helping researchers determine the sample size required to detect an effect of a given size with a certain degree of confidence. A study with insufficient power may fail to detect a meaningful effect, leading to false negatives (Type II errors). Tools and software packages like G*Power offer user-friendly interfaces for conducting power analyses across various statistical tests, including the t-test.

Non-Parametric Alternatives
When the assumptions of the t-test are violated, such as non-normality of the data or unequal variances that cannot be remedied through transformation, non-parametric alternatives come to the forefront. The Mann-Whitney U (Wilcoxon rank-sum) test is an alternative for independent samples. In contrast, the Wilcoxon signed-rank test caters to paired samples. These tests do not assume a specific data distribution. They can provide robust insights when the t-test’s assumptions are untenable.
Encouraging Continued Learning
The journey into statistical mastery does not end with mastering the Student’s t-test. The statistics and data science field is ever-evolving, with new methodologies, best practices, and software tools continually emerging. Engaging with the broader statistical community through forums, workshops, and conferences can keep you at the forefront of the field. Online resources, courses, and statistical software documentation offer avenues for further exploration and skill enhancement.
This section aims to equip you with advanced analytical tools and inspire an ongoing quest for knowledge and expertise in statistics and data science. By embracing continuous learning and exploration, you can uncover deeper insights from your data and contribute more effectively to your field of study or professional domain.
Ad Title
Ad description. Lorem ipsum dolor sit amet, consectetur adipiscing elit.
Conclusion
As we draw this comprehensive exploration of the Student’s t-test to a close, we reflect on the key insights and practical knowledge shared throughout this article. From its historical origins with William Sealy Gosset to its indispensable role in modern data analysis, the Student’s t-test is a fundamental tool for assessing the statistical significance of differences between groups.
We delved into the core principles underlying the t-test, including its assumptions, types, and the mathematical foundation that ensures its reliability. The application of the t-test in real-world scenarios across healthcare, education, and business analytics underscores its versatility and critical role in evidence-based decision-making. We navigated the intricacies of conducting the t-test through step-by-step guides, emphasizing the importance of assumption testing, proper test selection, and interpreting results.
The journey through common pitfalls and best practices highlighted the nuances of conducting rigorous statistical analyses, reminding us of the need for diligence and adherence to methodological standards. Our exploration extended beyond the basics, introducing advanced topics such as effect size, power analysis, and non-parametric alternatives, broadening our analytical toolkit and encouraging a deeper engagement with statistical challenges.
As you apply the knowledge gained from this article in your research and analysis endeavors, remember that statistics is not just about numbers and calculations; it’s a gateway to uncovering truths, making informed decisions, and contributing to a broader understanding of the world. Let the Student’s t-test principles guide your pursuit of truth in data analysis.
We encourage you to continue exploring, learning, and challenging yourself within the vast and dynamic statistics and data science field. The path of knowledge is endless, and every analysis, every dataset, and every research question offers an opportunity to grow, innovate, and contribute to the collective wisdom of the scientific community.
In closing, let the Student’s t-test be not just a statistical method you employ but a stepping stone towards more extraordinary discoveries, deeper insights, and a more profound appreciation for the intricate dance of numbers that narrate the stories of our world.
Recommended Articles
Dive deeper into statistical mastery with our curated selection of related articles. Expand your knowledge and elevate your data analysis skills today!
- ANOVA and T-test: Understanding the Differences and When to Use Each
- What is the Difference Between the T-Test vs. Chi-Square Test?
- Paired T-Test: A Comprehensive Guide
- Two-Sample t-Test in R Explained
- Example of Paired t-Test
Frequently Asked Questions (FAQs)
Q1: What is the Student’s t-test used for? The Student’s t-test is utilized to compare the means of two groups, making it an essential tool for researchers and analysts to determine if observed differences are statistically significant, informing evidence-based decision-making across various fields.
Q2: How do you interpret a Student’s t-test? Interpreting a Student’s t-test involves examining the p-value, which indicates the probability of observing the data if the null hypothesis were true. A p-value below the chosen significance level (usually 0.05) suggests a statistically significant difference between the groups.
Q3: What does a student t-test is a significance test that assesses? The Student’s t-test assesses the significance of the difference between the means of two groups. It helps determine whether observed differences are likely due to chance or reflect a true population difference.
Q4: What is the difference between student t-test and paired t-test? The Student’s t-test typically refers to an independent t-test, comparing the means of two independent groups. In contrast, a paired t-test compares means from the same group at two different times or under two different conditions.
Q5: When should you use the Student’s t-test? The Student’s t-test is appropriate when comparing the means of two independent groups, especially with small sample sizes and approximately normally distributed data.
Q6: What are the assumptions of the Student’s t-test? The t-test assumes independence of observations, normality of data distribution within each group, and homogeneity of variances between groups.
Q7: How do you check assumptions for the Student’s t-test? Assumptions can be checked using graphical methods like QQ plots for normality and statistical tests like Levene’s test for equality of variances.
Q8: Can you use the Student’s t-test for non-normal data? While the t-test is robust to slight deviations from normality, significantly skewed data may require non-parametric alternatives like the Mann-Whitney U test for independent samples or the Wilcoxon signed-rank test for paired samples.
Q9: What is effect size in the context of the Student’s t-test? Effect size, such as Cohen’s d, quantifies the magnitude of the difference between groups, providing insight into the practical significance of the test results beyond mere statistical significance.
Q10: Where can I find more resources on the Student’s t-test? Additional resources on the Student’s t-test can be found in statistical textbooks, academic journals, and reputable online platforms focused on data analysis and statistics.