Sample Size for t-Test: How to Calculate?


Are you aware that calculating the sample size for a t-test is a critical step in data analysis, which saves you time and money? Did you know that an adequate sample size makes your results more reliable? Despite its importance, many researchers collect and analyze their data without addressing this step, potentially compromising the reliability of their results. Fortunately, this often-overlooked step is quite simple!
In this article, we’ll present the correct way to calculate the sample size for a t-test using an excellent free statistical program.
Calculating the sample size is necessary to determine how many participants are required to detect a significant effect. It may not be possible to detect an existing effect if the sample size is too small. However, large samples can waste time, resources, and money. Therefore, optimizing sample size is crucial.
Additionally, sample size calculation at the study design stage is increasingly required, for example, when seeking ethics committee approval for research projects involving humans or animals and subsequent publication.
To calculate the sample size for the t-test, we will use G*Power, an excellent free program to calculate sample sizes for various analyses.
First, download, install, and open the program.
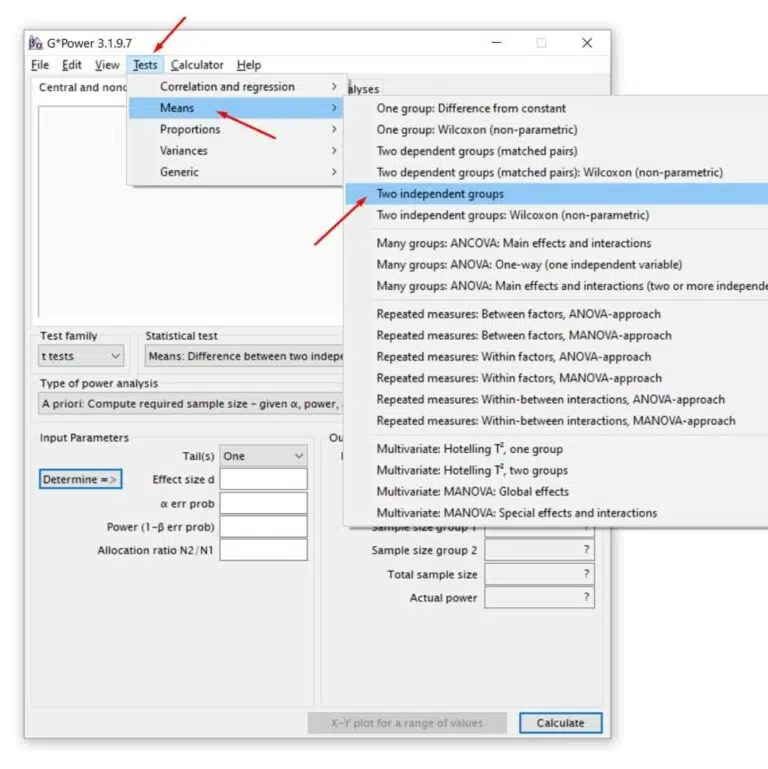
Next, select the desired test, the independent samples t-test. Click on the Tests: Means: Two independent groups tab. Now, let’s fill in the fields!
Now, let’s fill in the fields!
1. Tail(s): Choose ‘One’ if the test is one-tailed or ‘Two’ if the test is two-tailed. Use a one-tailed test if your alternative hypothesis is that the mean of one group is greater than the other. But, if your alternative hypothesis is that the means are different between the groups, without distinguishing which is higher or lower, use the two-tailed test. Base this hypothesis on existing knowledge in the study area. If unsure, leave the option at ‘Two.’
2. α err prob = significance level (α): Probability of rejecting the null hypothesis (H0) when it is true (type I error). Commonly used values are 0.05 or 0.01. A significance level of 0.05, for example, indicates a 5% risk of concluding that a difference exists when there is no actual difference.
3. Power (1 – β err prob) = Power of the Test (1 – β): Probability of rejecting the null hypothesis if it is false, i.e., how well the test controls for type II error. Acceptable values are typically between 0.80 and 0.99. The higher the test’s power, the
4. Allocation ratio N2/N1 = Allocation ratio between groups N2/N1: If you intend that the sample size of both groups is the same, then enter the value 1. Enter the required value if you want another allocation ratio between the groups.
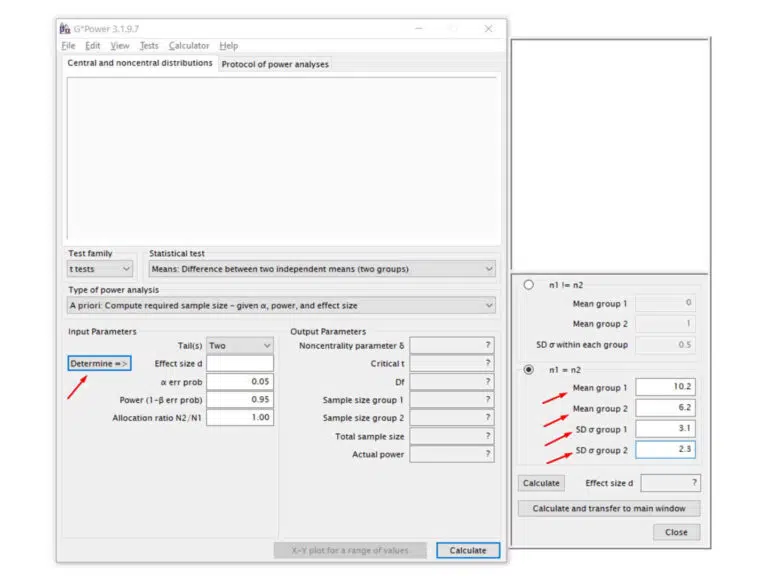
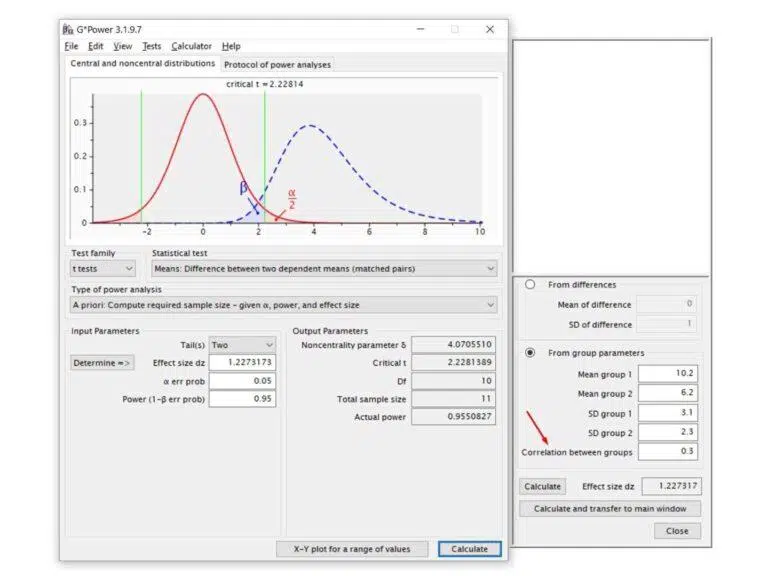
5. Effect size d = Cohen’s effect size (d): This measure represents the strength of the difference detected between the tested groups. Conventionally, d = 0.20 is considered weak, d = 0.50 medium, and d = 0.80 strong. To set d for your sample size calculation, click “Determine =>,” and a new tab will open. In this new tab, we must input values for the two groups’ mean (Mean) and standard deviation (SD σ)
Suppose you’re at the stage of calculating the sample size for your research. In that case, you may still need to collect the data to compute the mean and standard deviation. For this calculation, you need an estimated value obtained from a pilot collection with few observations. These values can also be acquired from other studies with populations, species, or conditions similar to your research or even from theoretical models.
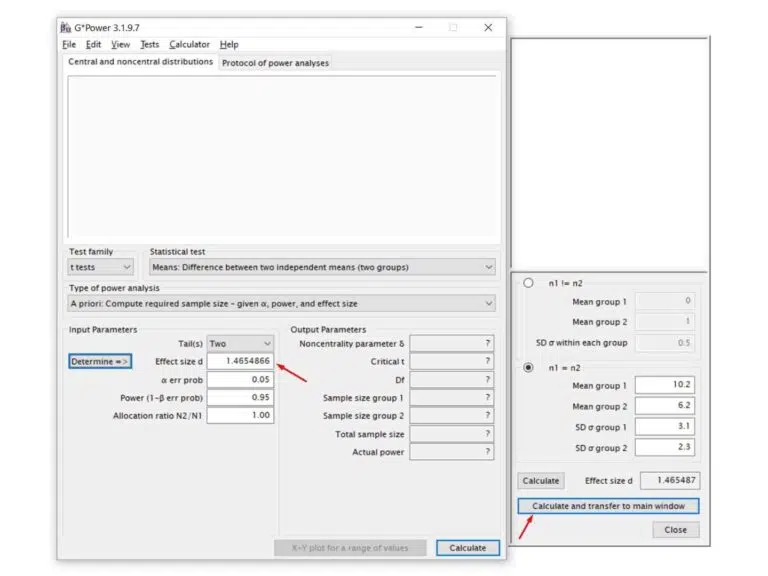
Now click Calculate and transfer to main windows. The estimated d value for your data will be calculated, and the Effect size d field will be filled in.
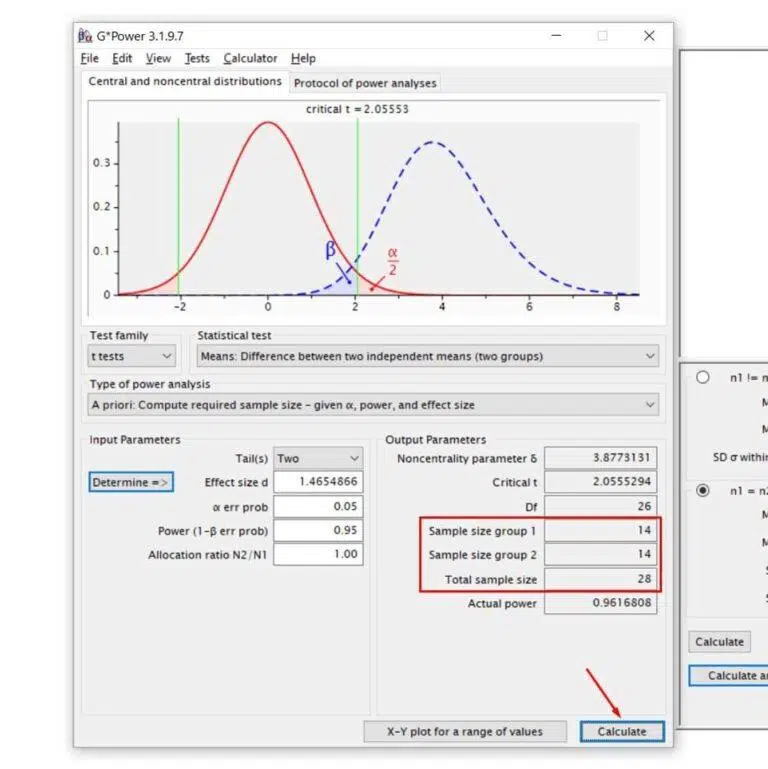
Finally, click on Calculate, and voilà… Now you have the total sample size and those of groups 1 and 2!
To calculate the sample size for the dependent samples t-test, click the Tests: Means: Two dependent groups (matched pairs) tab.
Then fill in the data exactly as we learned for the independent samples t-test. The only difference is that now you need to enter a value for Correlation between groups. Then, run a Pearson correlation between the two groups using the pilot collection data to obtain this value. Finally, fill in the obtained r-value.
Calculating the sample size for the t-test is a straightforward but essential step for obtaining more reliable results, saving time, and conserving resources. You’ll need some preliminary data concerning the two groups you’re comparing in the calculation. This data can come from a pilot collection, be compiled from other similar studies, or be theoretically estimated.
Do you feel prepared to discover the key to performing a flawless t-test now that you have learned how to determine its sample size? Read this article to find out: The Secrets of the t-Test.
Want to learn how to calculate sample size in G*Power for the most crucial inferential analyses?
Don’t miss out on the FREE samples of our recently launched digital book!
Inside, you’ll master sample size calculation for independent or paired t-tests; one- or two-way ANOVA, with or without repeated measures, and mixed models; simple and multiple linear and logistic regression, and more.
Click this link and discover everything it has to offer: Applied Statistics: Data Analysis.

Discover the power of our user-friendly Standard Deviation Calculator. The standard deviation importance!

In Science, What is a Dependent Variable? Learn to differentiate them from independent variables and discover real-world applications.

Dive into the crucial difference between correlation vs causality in data analysis, and learn how to avoid common pitfalls and misconceptions.

Learn how to find Cohen’s d, a crucial statistical measure quantifying the standard difference between two means in data analysis.

Unlock the potential of Bayesian Statistics with our practical guide for frequentist statisticians, featuring hands-on R examples.

Discover the key differences in the “mann-whitney vs t-test” debate and understand their applications in statistical analysis.