
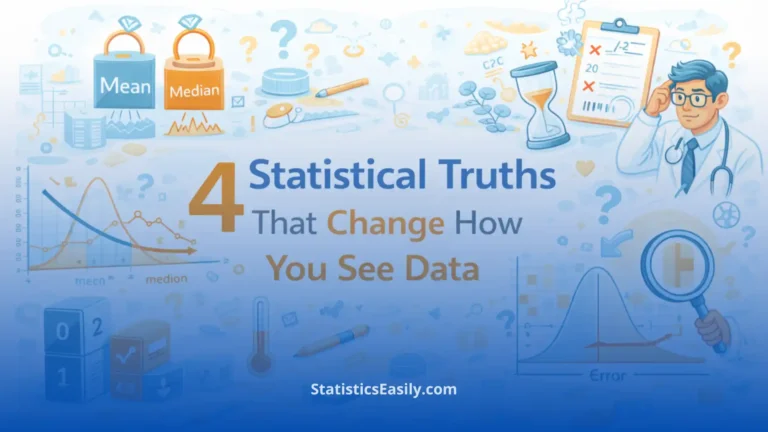
4 Statistical Truths That Will Change How You See Data
Statistical truths can change how you interpret numbers. Learn mean vs median, what “error” really means, why outliers matter, and how data gets adjusted.
Statistical truths can change how you interpret numbers. Learn mean vs median, what “error” really means, why outliers matter, and how data gets adjusted.
Master the art of graph creation using iNZight, a free software offering various chart types and inferential analysis for compelling data presentations.
Statistics And Fake News: Understand Why The [Mis]Use Of Statistics Can Significantly Impact The Acceptance As Truth Of Fake News.
Discover how to select the perfect graph for your data. Learn about quantitative and qualitative variables and explore different graph types.