

4 Statistical Truths That Will Change How You See Data
Introduction: Beyond the Numbers
Every day, we swim in an ocean of data, accepting the charts and figures that wash ashore as undeniable fact. We see a number presented in a report or a headline and tend to accept it at face value, shaping our understanding of everything from public health to the economy.
But the journey from a raw measurement to a final, polished statistic is filled with crucial decisions and hidden complexities. The numbers don’t speak for themselves; they are part of a story told by the people who analyze them. As the physicist Lord Kelvin famously stated, measurement is the foundation of knowledge:
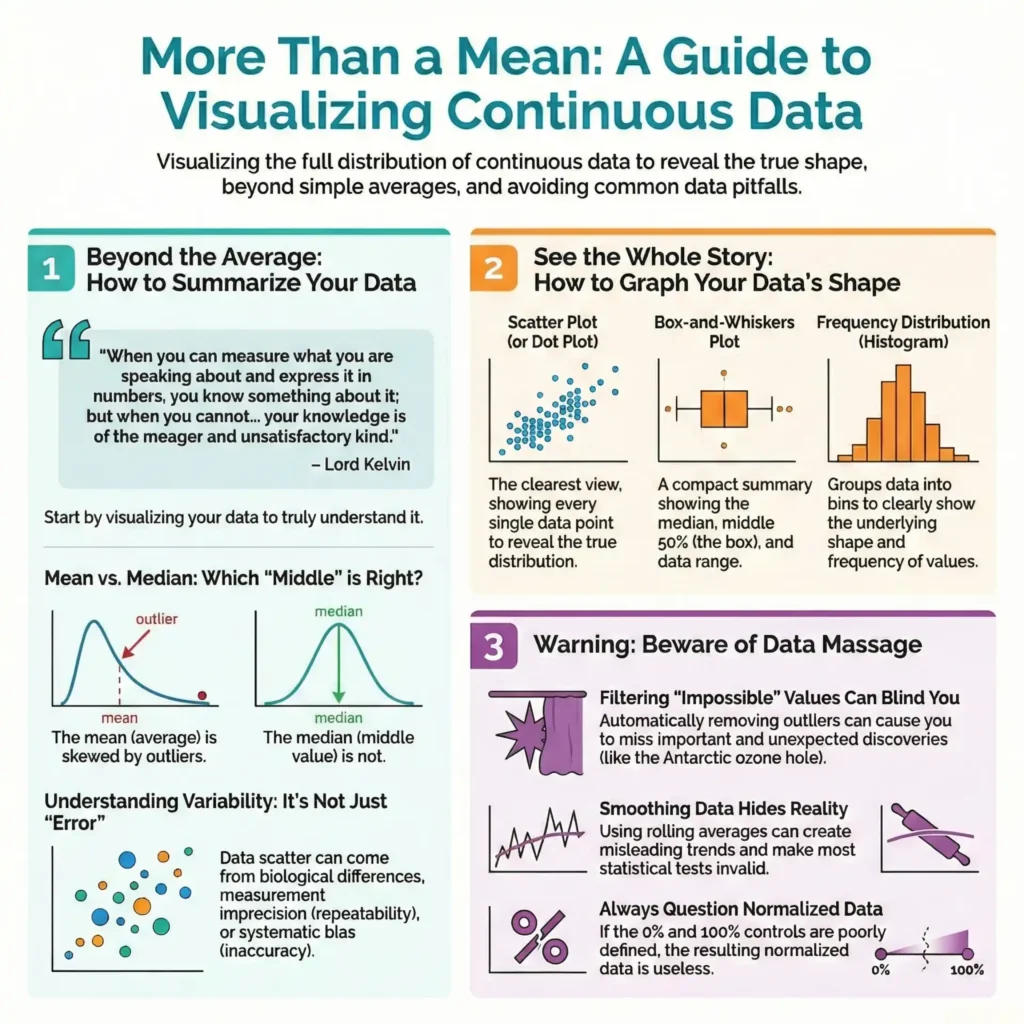
When you can measure what you are speaking about and express it in numbers, you know something about it; but when you cannot measure it, when you cannot express it in numbers, your knowledge is of a meager and unsatisfactory kind.
This post will pull back the curtain on that process. We’ll uncover four surprising and impactful “behind-the-scenes” statistical concepts that are essential for anyone who works with, or simply consumes, data in our modern world.
1. The “Average” Wedding Doesn’t Exist
When we hear the word “average,” we almost always think of the arithmetic mean: the sum of all values divided by the number of observations. However, another crucial measure of the “middle” is the median, which is simply the middle value when all the data is ranked in order.
So how can the “average” wedding cost in the United States be both $27,021 and 16,886? The answer reveals one of the most common ways statistics can mislead us. In 2011, the **mean** cost was indeed **27,021**. But the median cost was only $16,886. The discrepancy lies in the distribution of the data. A small number of extremely expensive weddings pull the mean upward, creating a value that isn’t representative of what most people actually spend. The median, on the other hand, is not influenced by these extreme outliers. It tells a more accurate story of the “typical” experience, making it a far more useful number for skewed distributions like this one.
2. In Statistics, “Error” Isn’t a Mistake
In everyday language, the word “error” means a mistake or something done incorrectly. In the world of statistics, however, the term has a completely different and far more neutral meaning.
In statistics, “error” is a technical term that has a completely different and far more neutral meaning. As the source text puts it, “error is often used to refer to any source of variability, as a synonym for scatter or variability.” This distinction is critical. When we see variability in a data set—say, different body temperatures among a group of healthy people—it’s not because someone made a mistake. This “error” is the result of natural sources of variation, such as biological variability between individuals or the inherent imprecision (or repeatability) of an experimental measurement. Shifting our understanding of “error” from “blunder” to “variability” allows us to stop asking “Who messed up?” and start asking the more productive question: “What are the natural sources of this variation?”
3. How “Impossible” Data Saved the World
A common first step in data processing is to screen for and remove “impossible” values. A person’s weight can’t be negative, and the year of death can’t come before the year of birth. Removing these obvious mistakes seems like simple, logical housekeeping, but this practice carries a hidden and profound risk.
The story of the ozone hole provides a powerful cautionary tale. In 1985, when researchers first began noticing a dramatic decrease in ozone levels over Antarctica, their software flagged the values as unusual because they were the lowest ever seen. The investigators could have easily dismissed these data points as instrumental glitches or impossible readings. Instead, they investigated further, confirming their instruments and calculations were correct. This led to the monumental discovery that chlorofluorocarbons were destroying the ozone layer and resulted in international action to prevent a global environmental catastrophe.
The lesson is a powerful one. If the investigators had automatically removed these “impossible” values, they would have made a big mistake and missed an important discovery.
4. The Trend That Was Built on “Adjustments”
The compelling graphs we see in reports and news articles often don’t plot the raw data that was actually collected. More commonly, they show data that has been adjusted, normalized, or smoothed to account for inconsistencies or to make a trend more visible.
Consider the definitive chart of global warming—that steady, upward climb of global temperatures. That trend, which has shaped international policy, isn’t a simple plot of thermometer readings. It’s a story constructed through a series of critical, and massive, statistical adjustments. The raw data requires numerous corrections, accounting for factors like the urban heat island effect (cities are warmer), the use of different thermometer types over time, and inconsistent measurement schedules. The impact of these corrections is enormous. The source states, “The net result of all these adjustments pushed earlier temperatures down by almost 1˚C, which is about the observed temperature increase in the past century.”
This doesn’t invalidate the conclusion, but it reveals a critical insight: the final trend is a product of both data and scientific judgment. These adjustments are necessary, but they require careful thought, and different scientists may make them differently. This underscores the importance of always asking how the data was processed before it was turned into a definitive graph.
Conclusion: Ask a Better Question
From choosing a median over a mean, to deciding what data is truly “impossible,” to determining how to adjust for external factors, the journey from data collection to a final conclusion is paved with human choices. Statistics are not just objective facts that emerge from a spreadsheet; they are the product of a process involving careful thought, critical judgment, and informed decisions.
The next time you’re presented with a compelling chart or a definitive statistic, what’s the first question you’ll ask about the story behind the numbers?