What Is The Standard Deviation?
Standard deviation is a measure that quantifies a dataset’s variation or dispersion. It indicates how data points deviate from the mean and is especially useful when the data fits a normal distribution.
You may have encountered the term standard deviation before. It is typical in reports, theses, dissertations, and various articles. Despite its popularity, it often needs to be understood. Can you explain what standard deviation is and when it should be applied?
The Problem
Descriptive statistics primarily consist of measures of central tendency and measures of variability.
When combined, they form the foundation for many statistical analyses and charts.
However, using only one of these measures to describe a population or sample could lead to incomplete or misleading information.

In the example of the river’s depth provided by Woody Hayes, relying solely on the mean as an indicator was insufficient to prevent a person from drowning.
This highlights the importance of using a measure of variability with a measure of central tendency.
Let’s consider another example.
The following three datasets have the same mean (20) but exhibit vastly different variability:
- A = 20,20,20,20,20
- B = 18,19,20,21,22
- C = 00,10,20,30,40
With a measure of variability, these crucial differences are noticed.
Central tendency measures, such as the mean, median, and mode, are relatively straightforward.
However, measures of variability can be less intuitive and, depending on the type, harder to comprehend.
These measures include range, mean absolute deviation, variability, standard deviation, and coefficient of variation.
Standard deviation is widely used, but often without fully comprehending what it represents.
So, what does standard deviation mean, and when should it be employed?
The Solution
Some concepts used here are based on the book Statistics Without Math, which offers an in-depth discussion.
The standard deviation measures data variability, indicating how data points deviate from the mean.
Other measures of variability include the range and the mean absolute deviation, which are more straightforward and intuitive.
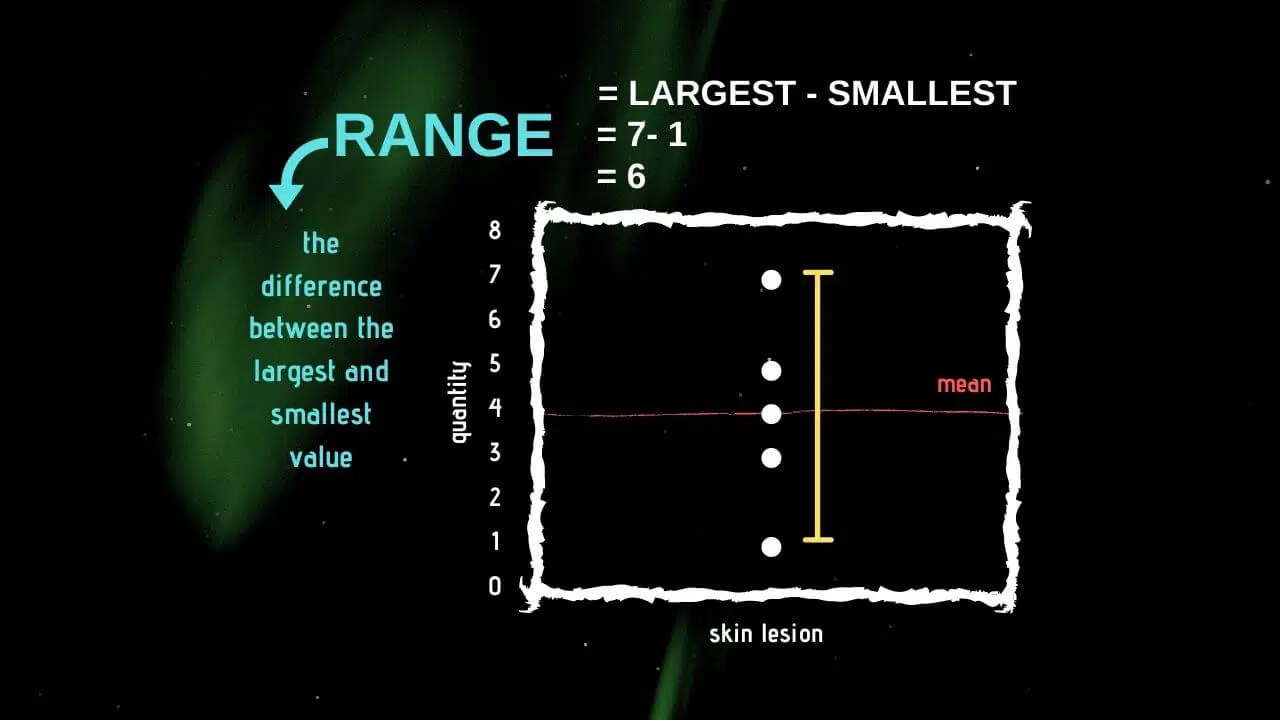
The range represents the difference between a dataset’s highest and lowest values.
While simple, it only uses two values from the entire dataset.
Conversely, the mean absolute deviation, or “the average of the absolute distances from each data point to the mean,” is slightly more complex but still intuitive.

Despite its intuitiveness, the mean absolute deviation is not the most commonly used statistic to describe data variability.
That title goes to the somewhat counterintuitive standard deviation.
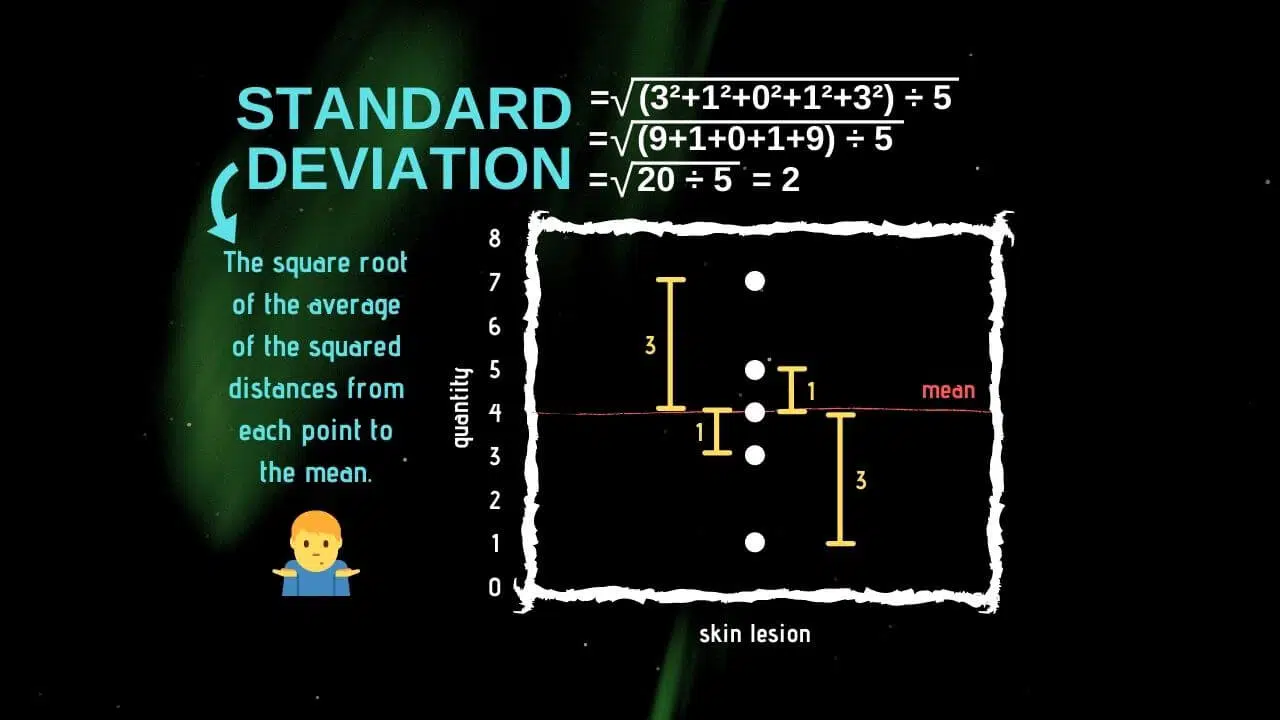
Similar to the mean absolute deviation, standard deviation is based on the differences between each observation and the mean.
However, these differences are squared in standard deviation, and the square root is extracted at the end.
The standard deviation is a more complex measure of variability.
Nevertheless, it proves valuable when analyzing data that fits a normal distribution.
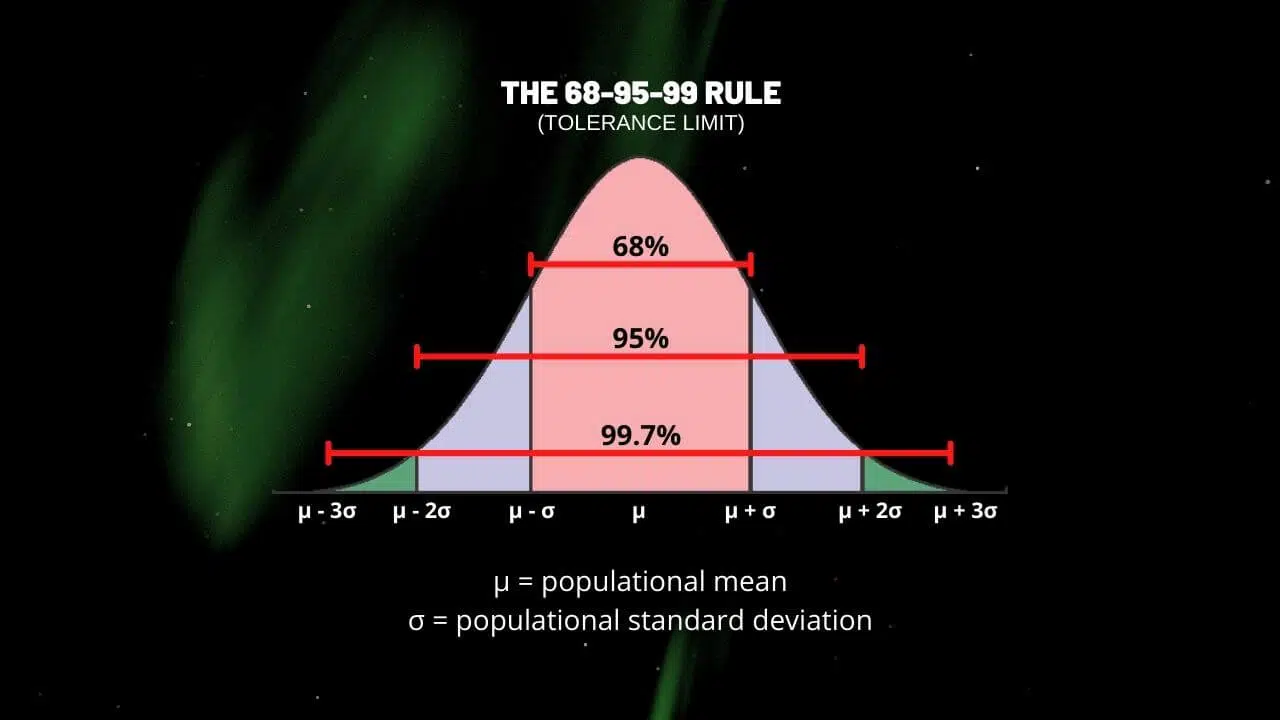
In such instances, roughly 68% of the values fall within one standard deviation, about 95% within two standard deviations, and nearly all within three standard deviations.
This is the 68-95-99 rule, also known as the tolerance limit! The Empirical Rule!
Ronald Fisher advocated using the standard deviation under “ideal circumstances,” with data fitting the normal distribution.
However, if the data does not fit the normal distribution, the standard deviation may not help describe variability.
Concluding Remarks
The standard deviation is a variability measure best used when data perfectly fits a normal distribution.
However, the mean absolute deviation has proven more effective in estimating variability, especially when data does not fit the normal distribution.
Due to its easier comprehension, intuitive nature, and superior performance with realistic data, the mean absolute deviation is an excellent alternative for representing data variability.