
Decision Trees: From Theory to Practice in Python for Aspiring Data Scientists
You will learn the foundational principles of Decision Trees and their practical application in Python for data-driven insights.
Introduction
Decision Trees are a cornerstone in data analysis, data science, and machine learning, offering a framework that simplifies complex decision-making processes through its intuitive structure. These models break down data into understandable segments, enabling seasoned experts and novices to uncover patterns and insights with clarity. The elegance of Decision Trees lies in their ability to turn intricate datasets into visually comprehensible and logically organized information, facilitating informed decisions and predictions. This introductory exploration will set the foundation for leveraging Decision Trees in Python, guiding aspiring data scientists from theoretical understanding to practical application.
Highlights
- Decision Trees classify data with unparalleled simplicity and accuracy.
- Python’s scikit-learn makes implementing Decision Trees straightforward.
- Decision Trees illuminate complex data, offering clear paths to decision-making.
- Optimization techniques enhance Decision Trees’ precision without overfitting.
- Visualizing Decision Trees in Python demystifies data analysis processes.
Ad Title
Ad description. Lorem ipsum dolor sit amet, consectetur adipiscing elit.
Understanding Decision Trees
Decision Trees are a method of data analysis that presents a hierarchical structure of decisions and their possible consequences, including chance event outcomes, resource costs, and utility. This method is compelling in data science for its clarity in decision-making and interpretability.
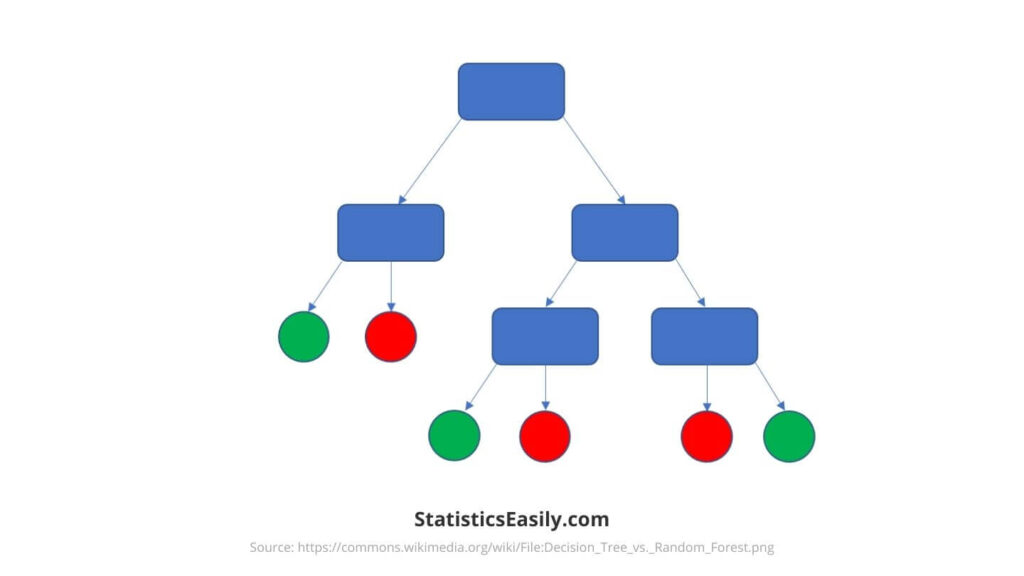
At their core, Decision Trees split data into branches based on decision criteria from the dataset’s features. These splits are made at nodes, with the first node being the tree’s root. Each node represents a decision point, and the branches represent the outcome of that decision, leading to further splits until the leaf nodes represent the outcomes or predictions.
Creating a Decision Tree involves determining the best feature to split on at each step. This decision is based on measures such as Gini impurity or entropy in classification tasks and variance reduction in regression. These criteria help choose the splits that most effectively purify the child nodes.
The depth of a Decision Tree measures the longest path from the root to a leaf. A deeper tree might model the training data more accurately but also risks overfitting — where the model performs well on training data but poorly on unseen data. Conversely, a shallow tree might be too simple to capture the underlying structure of the data, leading to underfitting.
Decision Trees are favored for their ability to model complex decision processes through a combination of simplicity and robustness. They can handle both numerical and categorical data, making them versatile for a wide range of applications. Furthermore, their structure allows for easy visualization and interpretation, making them an accessible tool for data scientists to communicate their findings.
The theoretical foundation of Decision Trees emphasizes the technical execution and the clear presentation of data-driven decisions. This aligns with the pursuit of truth and understanding in data science, illustrating how data can be dissected to reveal insights that guide actionable and informed decisions. Through this method, data scientists can navigate the complexities of their datasets, uncover patterns, and predict outcomes with a balance of precision and simplicity.
The Significance of Decision Trees in Data Analysis
The application of Decision Trees extends far beyond a single domain, demonstrating unparalleled versatility across various fields, including business analytics, healthcare, finance, and more. In business decision-making, for instance, they evaluate the potential outcomes of strategic choices, risk assessment, and customer segmentation. Healthcare professionals leverage Decision Trees for diagnosis prediction, patient risk assessment, and treatment effectiveness analysis, offering a roadmap to personalized medicine and improved patient care.
One critical advantage of Decision Trees is their interpretability. Unlike many complex models that act as “black boxes,” Decision Trees visualize the decision-making process, enabling users to understand how conclusions are drawn. This transparency is invaluable in fields where understanding the rationale behind a prediction is as crucial as the prediction itself, such as healthcare and finance.
Furthermore, the ease of use associated with Decision Trees is noteworthy. They do not require extensive data preparation; categorical and numerical data can be handled directly, and the nonlinear relationships between parameters do not affect their performance. This user-friendly aspect ensures that Decision Trees remain accessible to a broad audience, including those with limited statistical or programming expertise.
The goodness of Decision Trees in the analytical realm is their ability to balance simplicity with powerful predictive capabilities. They can be applied to regression and classification problems, making them a versatile tool in the data scientist’s arsenal. Additionally, their structure allows for the easy application of techniques such as pruning, which helps avoid overfitting and ensures the model’s robustness and reliability.
Preparing Your Data for a Decision Trees Model
Data preparation is a pivotal stage in modeling, mainly when working with Decision Trees. This section delves into the essential steps of preparing your dataset: cleaning and splitting it into training and test sets. Each step ensures your model’s integrity and reflects the rigorous pursuit of truth in data science.
Cleaning Your Data involves identifying and correcting errors or inconsistencies in your dataset. This could mean dealing with missing values, removing duplicates, or correcting data entry errors. For Decision Trees, ensuring that the data is free from inaccuracies is crucial because such models directly interpret the data structure and content. Clean data forms the foundation upon which trustworthy and interpretable models are built.
Splitting Your Data into training and test sets is a critical step in evaluating the effectiveness of your Decision Tree model. The data is typically divided randomly, with a standard split of 70% for training and 30% for testing. The training set builds the model, while the test set evaluates its performance on unseen data. This step is crucial for assessing the model’s generalizability, ensuring it can make accurate predictions on new, unseen data. It is the essence of creating models that reflect reality and can be trusted to make decisions.
Building Your First Decision Trees in Python
Building a Decision Tree in Python demystifies the process of data analysis and machine learning, making it accessible even to beginners. This section guides you through creating your first Decision Tree using Python, emphasizing practical experience and clarity.
Setting Up Your Python Environment
1. Ensure you have Python installed on your computer. You can download it from python.org.
2. Install the necessary libraries using pip, Python’s package installer. Open your terminal or command prompt and run:
pip install numpy pandas scikit-learn matplotlib
These commands install NumPy and pandas for data manipulation, scikit-learn for machine learning, and matplotlib for visualization.
Loading and Preparing Your Dataset
1. Import the libraries and load your dataset. For this tutorial, let’s use the Iris dataset, a simple yet insightful dataset available directly in scikit-learn.
from sklearn.datasets import load_iris
import pandas as pd

iris = load_iris()
data = pd.DataFrame(data=iris.data, columns=iris.feature_names)
data['target'] = iris.target
2. Clean your dataset by checking for and handling missing values or outliers. The Iris dataset is already clean, so no further action is needed here.
3. Split your dataset into training and test sets to accurately evaluate your model’s performance.
from sklearn.model_selection import train_test_split

X = data.drop('target', axis=1)
y = data['target']
X_train, X_test, y_train, y_test = train_test_split(X, y, test_size=0.3, random_state=42)
Implementing a Decision Tree Model with Scikit-learn
1. Import the DecisionTreeClassifier from scikit-learn and create an instance of the classifier.
from sklearn.tree import DecisionTreeClassifier

dtree = DecisionTreeClassifier(random_state=42)
2. Fit the model to your training data.
dtree.fit(X_train, y_train)
Visualizing the Decision Tree
1. Visualize the trained Decision Tree to understand how it makes decisions.
from sklearn.tree import plot_tree
import matplotlib.pyplot as plt

plt.figure(figsize=(20,10))
plot_tree(dtree, filled=True, feature_names=iris.feature_names, class_names=iris.target_names)
plt.show()
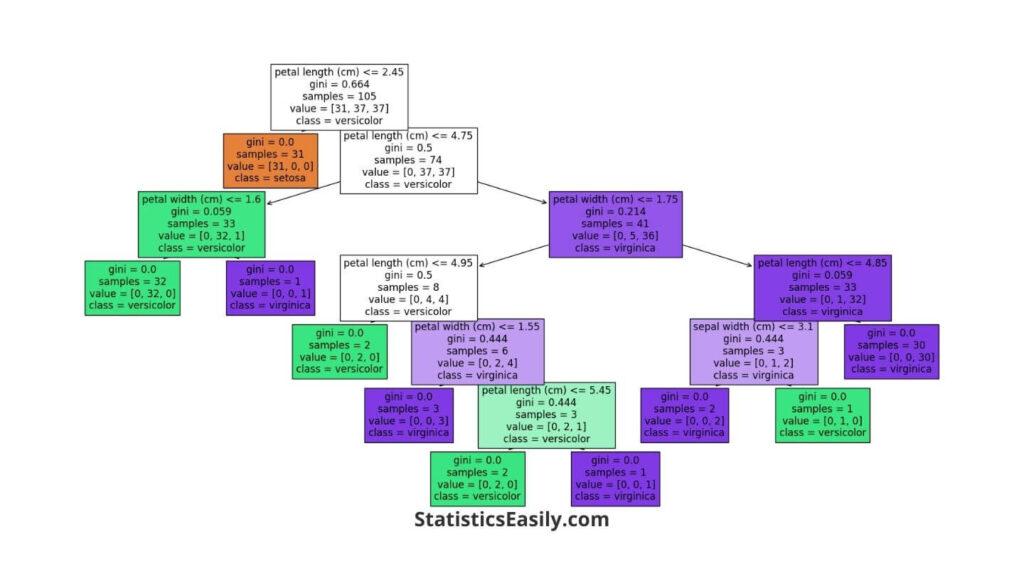
This image represents a Decision Tree model trained to classify iris flowers into one of three species. It’s based on the Iris dataset, which includes measurements like petal length and width. Here’s a breakdown of what we see in this Decision Tree:
- Nodes (Rectangles): Each rectangle is a node that makes a decision. The tree starts with the root node at the top and ends with the leaf node. The nodes test the data based on specific criteria, such as whether the petal length is less than a particular value.
- Branches (Lines connecting nodes): These lines guide the path from one decision to the next based on the criteria set by the nodes.
- Leaf Nodes (Ending rectangles): The final nodes (leaves) give us the predicted class (type of iris flower). They don’t split any further because they represent the most informed prediction the model can make with the given data.
- Gini (Metric in nodes): The Gini score measures purity — 0 is entirely pure (all samples in a node belong to the same class), and higher scores indicate a mix of classes within a node.
- Samples (In nodes): This tells us how many examples from the data are being considered at this point in the tree.
- Value (In nodes): This array shows the distribution of classes in the samples at that node. For example, [0, 34, 2] means 0 setosas, 34 versicolors, and 2 virginicas.
- Class (In nodes): This is the model’s prediction at that node. The decision tree will label any data point in that node with this class.
Looking at this Decision Tree, we can trace the decision-making path from the top to the bottom. For example, suppose we have an iris flower with a petal length of less than 2.45 cm. In that case, the Decision Tree will classify it as setosa (as seen in the leftmost leaf node). The tree provides a transparent way to see exactly how the model comes to a conclusion based on the input features.
Practical Example
Using the Iris dataset allows you to explore the nuances of Decision Trees without getting overwhelmed by complex data. With its simplicity and real-world applicability, this dataset ensures clarity and engagement, helping you grasp the basics of Decision Trees in Python.
You’ve created and visualized your first Decision Tree by following these steps. This process — from setting up your environment to analyzing a simple dataset — showcases the power and accessibility of machine learning in Python. Decision Trees offers a robust and interpretable method for data scientists at any level, whether for predictive analytics, data exploration, or gaining insights into complex datasets.
Evaluating and Optimizing Your Decision Trees Model
After building your Decision Tree model in Python, the next critical steps are evaluation and optimization. These processes ensure your model performs effectively and makes accurate predictions.
Evaluating Your Decision Tree Model
The performance of your Decision Tree model can be assessed using metrics such as accuracy, precision, and recall. Accuracy measures the proportion of correct predictions, precision reflects the model’s ability to identify only relevant instances, and recall indicates the model’s capability to find all pertinent cases within the dataset.
from sklearn.metrics import accuracy_score, precision_score, recall_score

predictions = dtree.predict(X_test)
print(f"Accuracy: {accuracy_score(y_test, predictions)}")
print(f"Precision: {precision_score(y_test, predictions, average='macro')}")
print(f"Recall: {recall_score(y_test, predictions, average='macro')}")
Techniques for Optimizing Decision Trees
Optimizing your Decision Tree involves adjusting parameters to improve performance and prevent overfitting. Key techniques include:
Pruning: Reducing the tree’s size to remove sections with little power to classify instances. Pruning can be achieved by setting parameters like max_depth, which limits the depth of the tree, and min_samples_split, which specifies the minimum number of samples required to split an internal node.
dtree_optimized = DecisionTreeClassifier(max_depth=3, min_samples_split=5, random_state=42)
dtree_optimized.fit(X_train, y_train)
Max Depth: Limiting the tree’s depth helps prevent the model from becoming overly complex and overfitting the training data.
Min Samples Split: Setting a minimum number of samples for a node to be split helps make the model more general and less likely to fit noise in the training set.
Ethical Considerations in Model Optimization
Optimizing a model goes beyond mere technical adjustments; it involves ethical considerations, especially ensuring the model’s predictions are fair and do not perpetuate biases. Overfitting affects the model’s accuracy on unseen data. It can lead to decisions that might not reflect the true nature of the data or reality. It’s crucial to balance model complexity with its interpretability and fairness, ensuring the decisions made by the model are justifiable and ethical.
Ensuring models accurately reflect reality underscores our commitment to truth. It involves rigorous testing on diverse datasets to detect and mitigate biases. Data scientists are tasked with the ethical responsibility of ensuring their models serve the good, avoiding harm that might come from inaccurate predictions.
Ad Title
Ad description. Lorem ipsum dolor sit amet, consectetur adipiscing elit.
Conclusion
The journey through Decision Trees‘s intricacies has unveiled these models’ profound capability to make data science both accessible and impactful. Through a blend of simplicity and depth, Decision Trees offer a lens to view complex datasets, making informed decisions more attainable. This exploration from theoretical concepts to practical application in Python highlights the versatility and power of Decision Trees. It stands as a testament to the beauty of data science itself.
Recommended Articles
Discover more cutting-edge techniques and insights in data science on our blog. Dive deeper into Decision Trees and beyond for a comprehensive understanding and practical application in your projects. Explore now!
- Descriptive Statistics and Inferential Statistics: Simplifying Data Analysis
- Generalized Linear Models in Python: A Comprehensive Guide
- Linear Regression with Scikit-Learn: A Comprehensive Guide
- P-hacking: A Hidden Threat to Reliable Data Analysis
- Logistic Regression Using Scikit-Learn (Story)
- Top 5 Free Tools for Data Analysis in 2024
Frequently Asked Questions (FAQs)
Q1: What are Decision Trees? Decision Trees are nonlinear predictive models used for classification and regression tasks in data science.
Q2: Why are Decision Trees important in data analysis? They offer intuitive, clear insights into complex datasets, making them essential for informed decision-making processes.
Q3: How do Decision Trees work in Python? Python’s libraries, like scikit-learn, allow for easy implementation and visualization of Decision Trees.
Q4: Can Decision Trees be used for both classification and regression? Yes, Decision Trees can handle both types of tasks efficiently, making them versatile tools in data science.
Q5: What makes Decision Trees uniquely valuable? Their simplicity and interpretability, without sacrificing accuracy, make them invaluable for analysts and scientists.
Q6: How do I evaluate the performance of a Decision Tree? Using metrics like accuracy, precision, and recall alongside visual inspections of the tree itself.
Q7: What are the main challenges with Decision Trees? Overfitting can be challenging, requiring techniques like pruning to manage tree complexity.
Q8: How do Decision Trees handle categorical and numerical data? They can inherently handle both types, splitting nodes based on the data type to optimize decisions.
Q9: What is pruning in Decision Trees? Pruning reduces the size of Decision Trees by removing sections of the tree that provide little power to classify instances.
Q10: How can Decision Trees be visualized in Python? Using libraries like matplotlib and Graphviz, Decision Trees can be visually represented for more straightforward interpretation.