
What Is the Mode in a Data Set?
You will learn the significance of ‘What Is the Mode in a Data Set’ in unraveling complex data patterns.
Introduction
Statistical analysis is a cornerstone in data science, offering a structured approach to deciphering complex data sets and extracting meaningful insights. A fundamental question is at the heart of descriptive statistics: “What is the mode in a data set?” Understanding the mode, the most frequently occurring value within a data collection is crucial for interpreting data distributions and trends. This knowledge not only simplifies the complexity of data but also illuminates the recurring patterns that underpin informed decision-making across various fields. Through this lens, we delve into the significance of the mode, a key player in unraveling the stories hidden within numbers, thereby fostering a deeper appreciation of the beauty and utility of statistical analysis.
Highlights
- The mode identifies the most frequent value, enhancing data understanding.
- Different data types exhibit unique mode calculations, revealing data trends.
- In bimodal or multimodal sets, multiple modes offer more profound insights.
- The mode’s application spans economics to healthcare, guiding critical decisions.
- Advanced concepts like weighted mode expand analytical capabilities.
Ad Title
Ad description. Lorem ipsum dolor sit amet, consectetur adipiscing elit.
Understanding the Mode
The mode is a fundamental measure in descriptive statistics that identifies the most frequently occurring value within a data set. It plays a pivotal role in statistical analysis by providing insights into the commonality and repetition of data values, thus offering a clear understanding of the data’s central tendency. The mode highlights the prevalence of specific values, which can be instrumental in various analytical contexts, from market research to social sciences.
Distinguishing Between Mode, Median, and Mean
While the mode, median, and mean are all measures of central tendency, they each provide different perspectives on a data set:
Mean: The arithmetic average of all data points, calculated by summing all values and dividing by the number of values. The mean offers a broad view of the data’s central location but can be skewed by extreme values.
Median: The middle value when a data set is ordered from the smallest to the largest. The median divides the data set into two halves. It is less affected by outliers, making it a reliable measure of central tendency in skewed distributions.
Unique Value of the Mode: The mode stands out for its ability to reflect the most common or popular occurrences within a data set. This makes it uniquely valuable in situations where the most frequent observation is of more interest than the average or middle value. For example, in consumer research, the mode can identify the most preferred product; it can reveal the most common symptom among patients in healthcare. Unlike the mean and median, the mode applies to numerical and categorical data, enhancing its versatility and utility in diverse analytical scenarios.
Calculating the Mode in a Data Set
Calculating the mode in a data set is a fundamental skill in statistics that provides insight into the most frequently occurring values within a data collection. This section offers a step-by-step guide on identifying the mode in various types of data sets, including unimodal, bimodal, and multimodal distributions. Real-life examples are included to illustrate the process, enhancing understanding and applicability.
Identifying the Mode in Unimodal Data Sets
An unimodal data set has a single value that occurs more frequently than any other. To find the mode:
- Organize the Data: Arrange the data in ascending or descending order for clarity.
- Count the Frequencies: Tally the number of occurrences for each value.
- Identify the Mode: The value with the highest frequency is the mode.
Example: In a data set of test scores [82, 90, 76, 82, 91, 82, 88], the score 82 occurs three times more than any other score, making it the mode.
Determining the Mode in Bimodal and Multimodal Data Sets
Bimodal data sets have two modes, and multimodal data sets have three or more modes. Identifying these is similar to unimodal data sets but with a focus on multiple high-frequency values.
- Organize the Data: Sort the data for better visualization.
- Count the Frequencies: Calculate the frequency of each data point.
- Identify Multiple Modes: Values with the highest frequencies are the modes.
Example: In a data set [4, 2, 1, 3, 4, 2, 5, 1, 2], 2 and 4 occur thrice, making this set bimodal.
Special Considerations
- No Mode: If no value repeats, the data set is considered to have no mode.
- Equal Frequencies: The mode is meaningless if all values occur with the same frequency.
Real-Life Example: Customer Satisfaction Survey
Consider a customer satisfaction survey with responses on a scale of 1 to 5, where 1 is “Very Dissatisfied”, and 5 is “Very Satisfied”. The collected responses are [3, 4, 2, 3, 5, 3, 4, 2, 5, 3].
- Organize and Count: The frequencies are {1: 0, 2: 2, 3: 4, 4: 2, 5: 2}.
- Identify the Mode: The most frequent response is 3, occurring four times. This indicates that the majority of customers are “Satisfied”.
The Importance of the Mode in Data Analysis
The mode, as the most frequently occurring value in a data set, serves as a critical tool in data analysis, offering unique insights that other measures of central tendency cannot provide. Its application extends across various disciplines, including economics, healthcare, and social sciences, proving its versatility and utility.
Scenarios Where the Mode Is Insightful
Consumer Behavior Analysis: Understanding the most popular product or service can be pivotal in marketing and consumer research. The mode identifies these preferences, helping businesses tailor their offerings to meet consumer demands effectively.
Healthcare Diagnosis and Treatment: In healthcare, the mode can highlight the most common symptoms or disease occurrences within a population. This insight is vital for prioritizing healthcare resources and strategies for widespread conditions.
Education: In educational settings, the mode can identify the most common scores or grades, helping educators understand the level at which most students perform and adjust their teaching methods accordingly.
Application of Mode in Various Fields
Economics: In economic research, the mode can reveal the most common income level within a population, providing insights into economic status and helping guide policies addressing income disparities.
Healthcare: The mode is used to identify prevalent diseases or symptoms within specific demographics, enabling healthcare providers to allocate resources more effectively and tailor public health interventions.
Social Sciences: In sociology or psychology, the mode can help understand social behaviors, attitudes, and trends by identifying the most frequent responses in surveys and questionnaires.
Incorporating Visuals for Enhanced Understanding
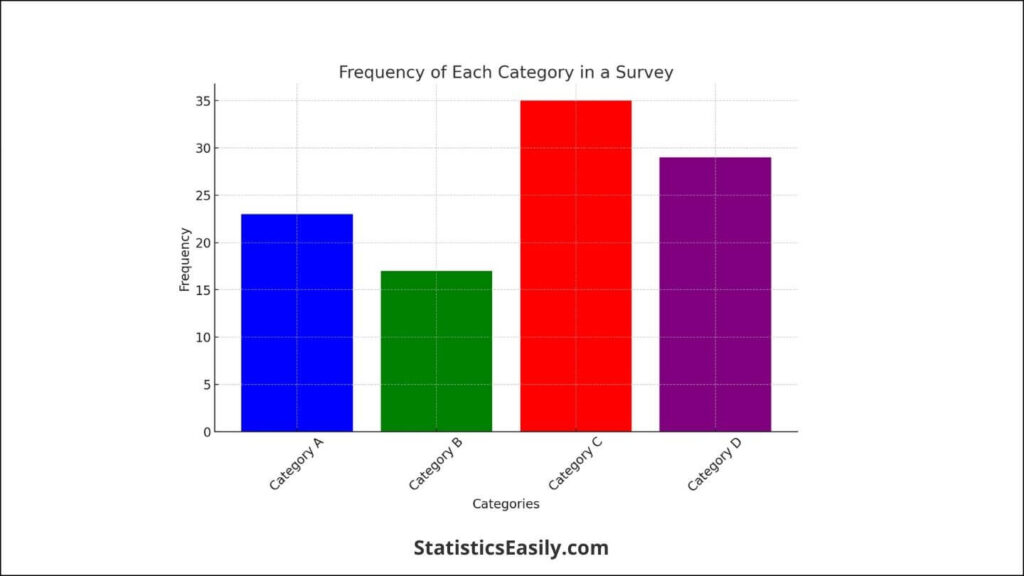
Graphs and charts can significantly enhance the comprehension of the mode’s application in data analysis. For instance:
A bar chart displaying the frequency of each category in a survey can vividly illustrate the mode by highlighting the category with the highest bar.
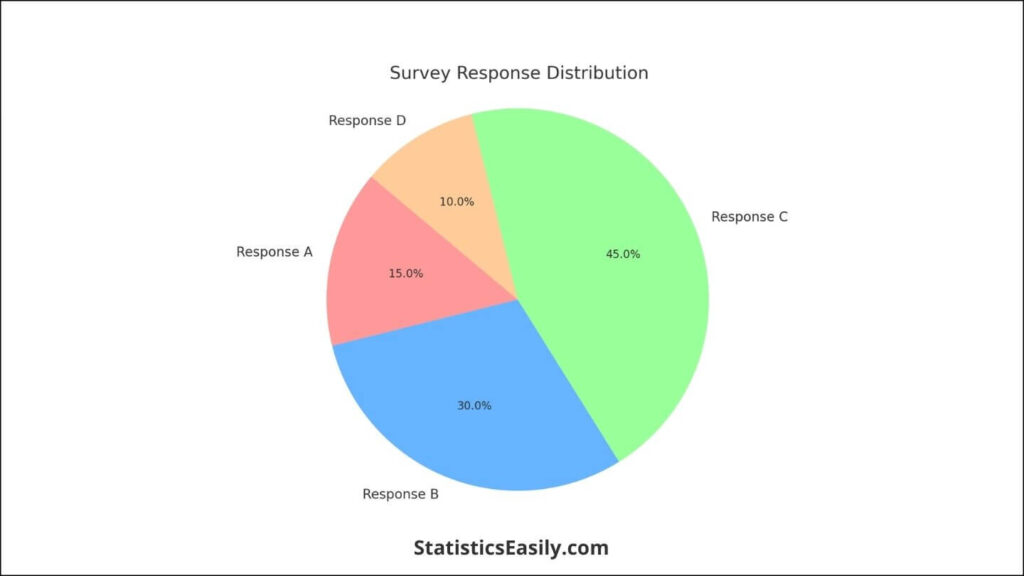
A pie chart could represent the questionnaire responses distribution, with the mode being the largest slice, indicating the most common response among participants.
Beyond the Basics – Advanced Insights
As we delve deeper into the intricacies of statistical analysis, it becomes essential to explore more complex concepts that extend beyond the foundational understanding of the mode. This advanced exploration broadens our analytical toolkit and enhances our capacity to interpret data with greater nuance and precision.
Weighted Mode and Its Applications
One such advanced concept is the weighted mode, which adapts the traditional notion of the mode to accommodate the varying significance of data points within a set. In many real-world scenarios, not all occurrences are of equal importance, and the weighted mode addresses this by assigning different weights to different values, thereby reflecting their relative significance in the analysis.
The application of the weighted mode is particularly relevant in fields where the frequency of occurrence does not fully capture the value’s impact or importance. For instance, in economic analyses, the weighted mode can determine the most common income bracket, considering the number of individuals within each bracket and their total income contribution to the economy. This approach provides a more nuanced understanding of economic distribution and can guide more targeted policy interventions.
Limitations of the Mode
Despite its utility, the mode, like any statistical measure, has limitations. One of the primary considerations is its sensitivity to sample size and the specificity of the data. In large datasets with a high degree of variability, the mode may not offer a clear insight into the central tendency, as multiple values may occur with similar frequency, leading to a bimodal or multimodal distribution that complicates interpretation.
Furthermore, the mode’s applicability is limited in continuous data or data with a high level of precision, as the chances of exact repetitions decrease, making the mode less informative. This limitation underscores the importance of selecting the appropriate measure of central tendency based on the nature of the data and the specific insights sought.
Considerations for Use
When employing the mode in data analysis, it’s crucial to consider the context and the nature of the data. The mode can offer valuable insights in categorical data, where the most common category is of interest, and in discrete data, where the occurrences of specific values are meaningful. However, its utility may be limited in continuous data or when a more detailed understanding of the data distribution is required.
Practical Applications and Case Studies
The beauty and elegance of unraveling complex data through simple measures like the mode cannot be overstated in statistical analysis. This section presents case studies and examples where the mode has provided significant insights, leading to actionable decisions in various fields. These instances underscore the profound impact of statistical analysis in uncovering truths and facilitating informed decisions, reflecting the essence of what is true in the pursuit of knowledge.
Case Study 1: Market Research and Consumer Preferences
Analysts sought to identify the most preferred product features among a diverse customer base in a comprehensive market research study for a leading consumer goods company. Utilizing the mode, the team analyzed survey data from thousands of participants, focusing on responses related to product preferences and satisfaction levels. The mode revealed a clear preference for eco-friendly packaging and organic ingredients, the most frequently cited features across the data set.
This insight guided the company in reevaluating its product lines and marketing strategies, developing a new range of products that aligned with consumer preferences. The launch of these products was met with overwhelming success, significantly increasing market share and consumer loyalty. This case study highlights the mode’s capacity to distill vast amounts of data into actionable insights, driving strategic decisions that resonate with consumer demands.
Case Study 2: Healthcare Diagnostics and Treatment Plans
In a regional healthcare analysis aimed at improving patient outcomes, epidemiologists utilized the mode to identify the most common symptoms and conditions presented at various healthcare facilities. The mode analyzed patient records and symptom frequencies and pointed to a prevalent viral infection with specific, identifiable symptoms.
Armed with this knowledge, healthcare providers were able to streamline diagnostic processes, reduce treatment times, and implement targeted public health campaigns to educate the population about prevention and early treatment. The intervention significantly decreased infection rates and improved patient outcomes, demonstrating the mode’s critical role in enhancing healthcare delivery and public health initiatives.
Case Study 3: Educational Curriculum Development
An educational institution analyzes student performance across various subjects to tailor its curriculum to meet student needs better. By applying the mode to grade distributions, educators identified students’ most common areas of difficulty, which were not apparent through mean or median-based analyses.
This insight led to the development of targeted support programs and revised teaching methodologies focused on these challenging areas. Subsequently, student performance metrics marked improvement, and overall satisfaction with the educational offerings increased. This case study exemplifies how the mode can uncover hidden patterns within data, enabling educators to make informed decisions that enhance learning outcomes.
Ad Title
Ad description. Lorem ipsum dolor sit amet, consectetur adipiscing elit.
Conclusion
In conclusion, the mode, the most frequently occurring value in a data set, stands out as a fundamental measure of central tendency and a beacon of simplicity in the complex realm of data analysis. Throughout this article, we have explored its definition, calculation, and the unique insights it provides across various fields, from consumer behavior to healthcare. The mode’s beauty lies in its ability to distill vast and varied data into a singular, most common value, offering a clear, accessible entry point into understanding the heart of a data set. This elegance in simplicity makes statistical analysis more approachable. It underscores the mode’s profound role in unraveling the stories hidden within our data, guiding decisions and strategies across disciplines with a gentle yet definitive touch.
Recommended Articles
Delve deeper into data science with our expertly curated articles on statistical methods and data analysis. Discover more insights and elevate your analytical skills by exploring our collection
- Measures of Central Tendency: Mean, Mode, Median
- How to Calculate the Median in Excel – Simple Steps
- 5 Statistics Case Studies That Will Blow Your Mind
- Cramer’s V and Its Application for Data Analysis
- Mastering the Mean
Frequently Asked Questions (FAQs)
Q1: What Defines the Mode in Statistical Analysis? The mode represents a data set’s most frequently occurring value, offering a quick glimpse into the data’s commonality.
Q2: How Is the Mode Different From the Mean and Median? While the mean calculates the average and the median denotes the middle value, the mode reflects the most common value, providing a distinct perspective on data distribution.
Q3: Can a Data Set Have More Than One Mode? Data sets can be bimodal or multimodal if they have two or more equally frequent values.
Q4: Why Is the Mode Important in Data Analysis? The mode is crucial for identifying the most common occurrences, aiding decision-making processes and trend analysis.
Q5: How Do You Calculate the Mode in a Large Data Set? To find the mode in large data sets, organize the data, count the frequency of each value, and identify the highest frequency.
Q6: Are There Any Limitations to Using the Mode? The mode’s effectiveness can be limited in uniformly distributed data or when unique values dominate the data set.
Q7: How Can the Mode Be Applied in Real-World Scenarios? The mode is used in various fields like market research and healthcare to identify popular products or common symptoms.
Q8: What Is a Weighted Mode and Its Application? A weighted mode considers the importance of each valuable value in weighted surveys or when specific data points carry more significance.
Q9: How Does the Mode Influence Data Visualization? The mode can affect the shape of histograms and bar charts, visually highlighting the most common values.
Q10: Can the Mode Be Used With Categorical Data? The mode is handy for categorical data, indicating the most frequent category or response.