
ANOVA: Don’t Ignore These Secrets
The secrets of ANOVA lie in its assumptions: independence of observations, normality, and homoscedasticity. Proper selection of ANOVA type, accurate sample size calculation, and careful post hoc analysis is crucial in obtaining valid results.
Are you aware that the incorrect application of statistical tests, including ANOVA, is more prevalent than we might assume and could lead us to erroneous conclusions? This is concerning because false findings can result in bad decisions. Therefore, we invite you to read this article thoroughly to avoid falling into this trap.
Highlights
- ANOVA is a statistical test used to compare the means of two or more groups.
- One-Way ANOVA and Repeated Measurements ANOVA are the most commonly used types of ANOVA.
- Violation of independence of observations can bias the analysis and yield misleading results.
- If ANOVA’s p-value is significant, post hoc tests can identify which groups differ.
- Misuse of ANOVA is common, rendering many study conclusions questionable.
The Issue
Feeling a sense of déjà-vu while reading this article? It’s probably because you’ve read our article “Student’s T-Test: Don’t Ignore These Secrets.”
These two tests, used for comparing means, bear many similarities.
If you haven’t read the previous article, we recommend opening it and making the necessary comparisons upon finishing this one. If you have read it, use this article as a basis for comparison and review.
Like the t-test, ANOVA’s wide availability and simplicity, combined with its easy understanding and application, have made it one of the most frequently used inferential statistical tests worldwide.
However, this “popularization,” akin to the t-test, has led to issues such as incorrect analysis usage.
Several recent systematic review articles reveal that nearly 80% of published papers in certain types of studies have errors in their statistical analyses!
Considering that the solutions to humanity’s problems often rely on these studies, it is unsettling to realize such a significant proportion of them may have been incorrectly analyzed, potentially leading to incorrect conclusions.
The “secrets” of correctly conducting an ANOVA are not complex.
Understanding a few fundamental characteristics of the analysis is all you need!
The Solution
ANOVA, an acronym for Analysis of Variance, is essentially a test to compare means — inferring whether the means of 3 or more groups are equal.
Typically, we use ANOVA to compare three or more groups and the t-test to compare two groups.
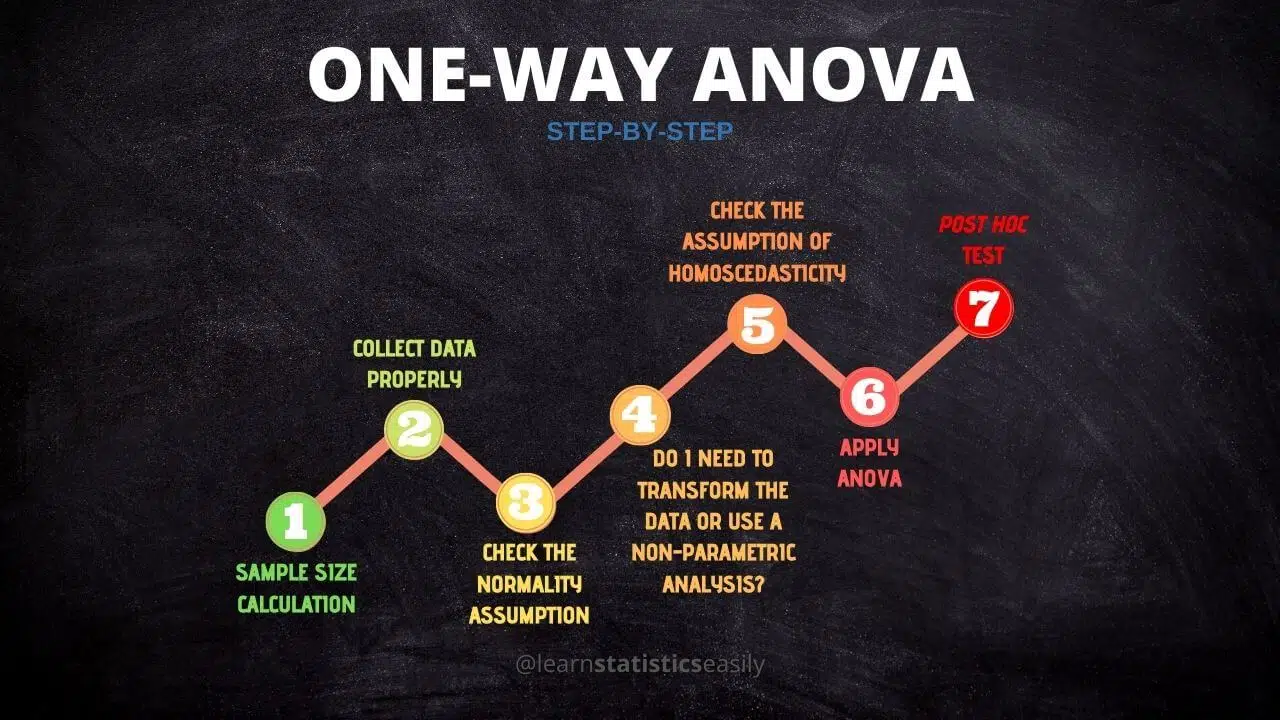
Pay close attention because the following six steps are crucial for a proper and unambiguous application of ANOVA.
1. Identifying the Appropriate Type of ANOVA
The most frequently used types of ANOVA are:
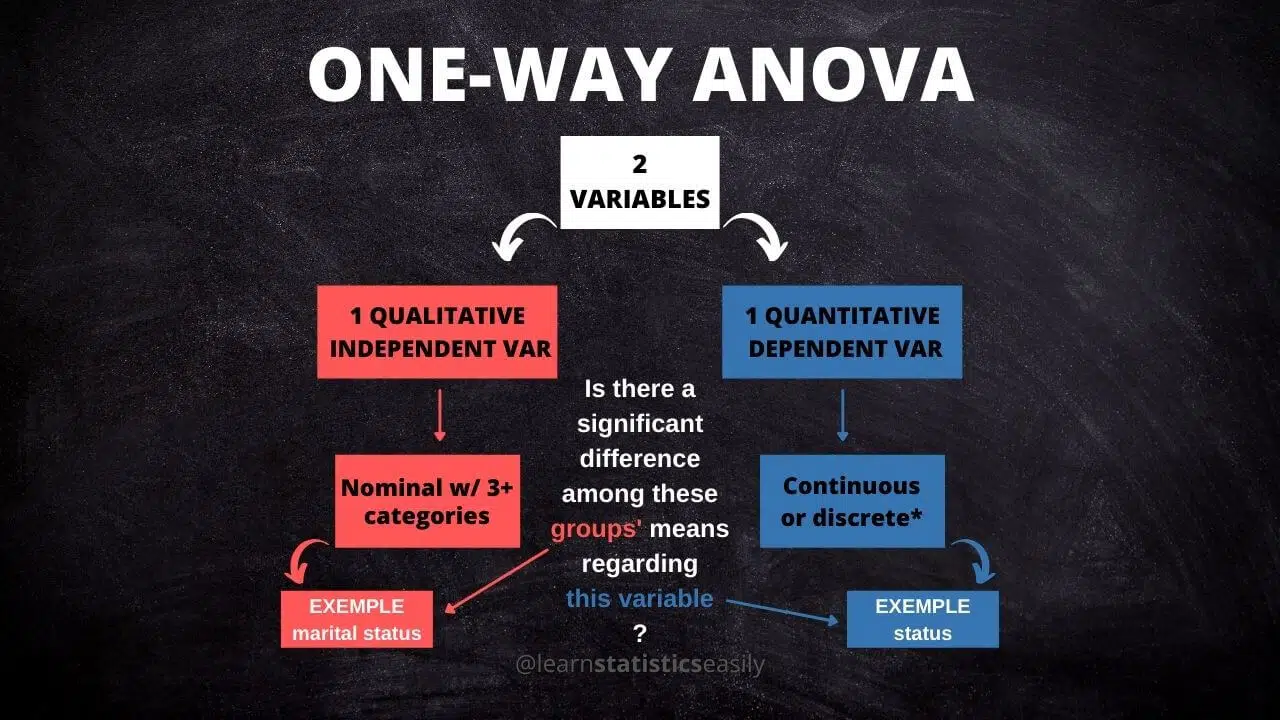
One-Way ANOVA
This is the most common type, which assesses whether the means of the samples taken from three or more independent groups are equal.
To be more technical, it checks the effect of a categorical independent variable on a continuous dependent variable.
For instance, it could be used to check if the wingspan averages among three different species of birds are equal.
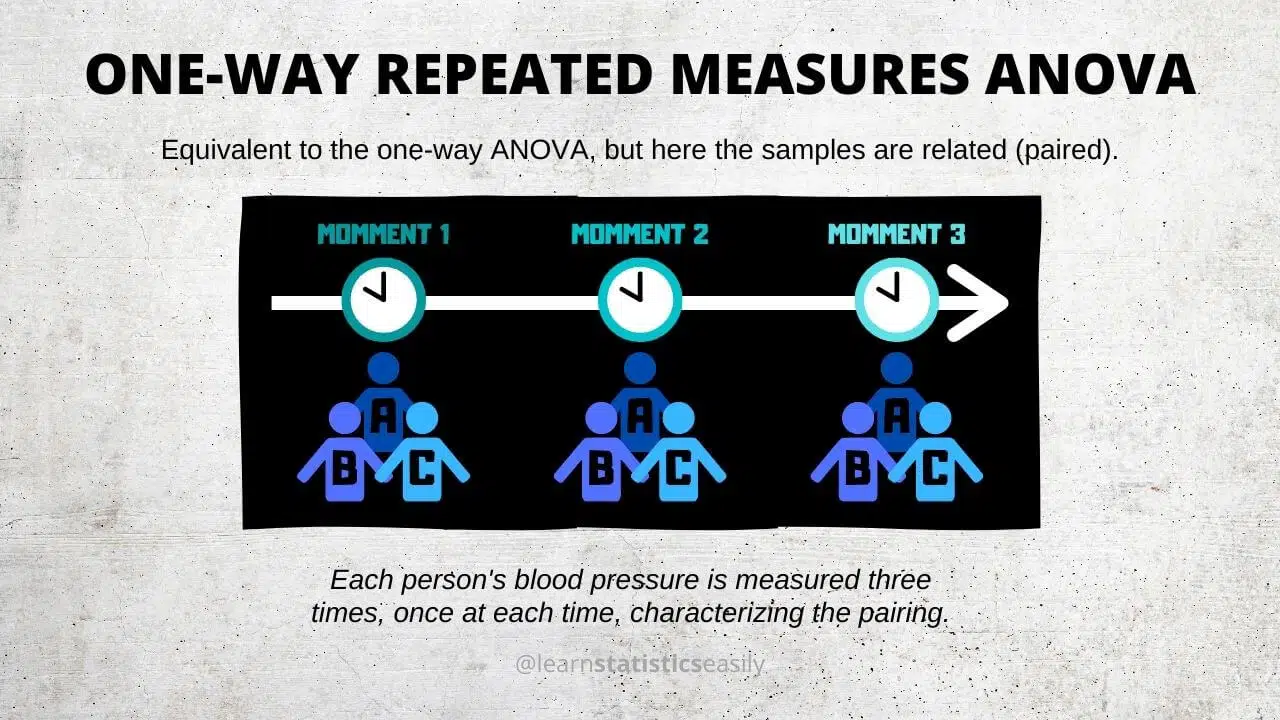
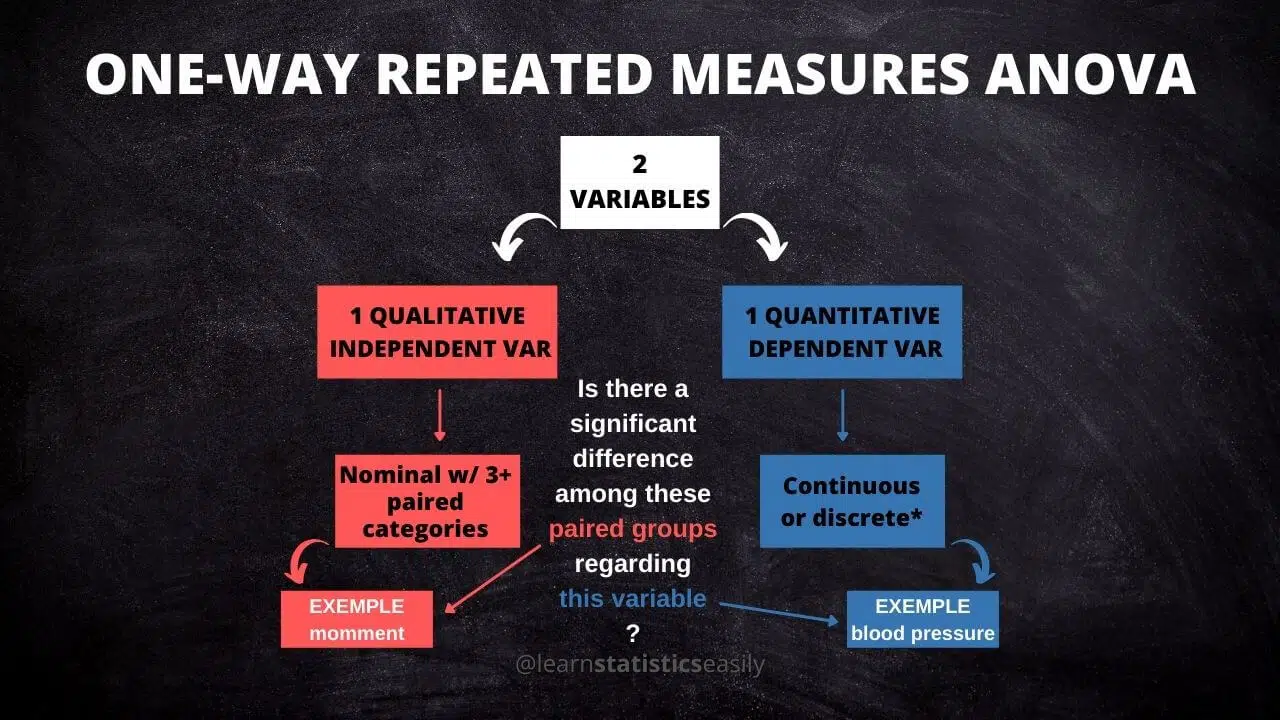
One-way Repeated Measures ANOVA
This type is equivalent to one-way ANOVA, but the samples between the three [or more] groups are dependent. That is, the samples are paired or related.
For example, suppose we want to check whether the mean blood pressures of older women in a city remain the same:
- One hour after taking the medicine
- Two hours after taking the medicine
- Four hours after taking the medicine
Here, since each woman’s blood pressure is measured three times — one hour, two hours, and four hours after taking medicine — there is a pairing of each sample unit (within-subject measures).
Other Types
In this post, we will not delve into other types of ANOVA, such as two-way ANOVA and two-way repeated-measures ANOVA.
The primary difference between these two analyses is that in repeated measures ANOVA, the samples are paired.
These represent an extension of the one-way ANOVA and check the influence of two independent categorical variables on a continuous dependent variable.
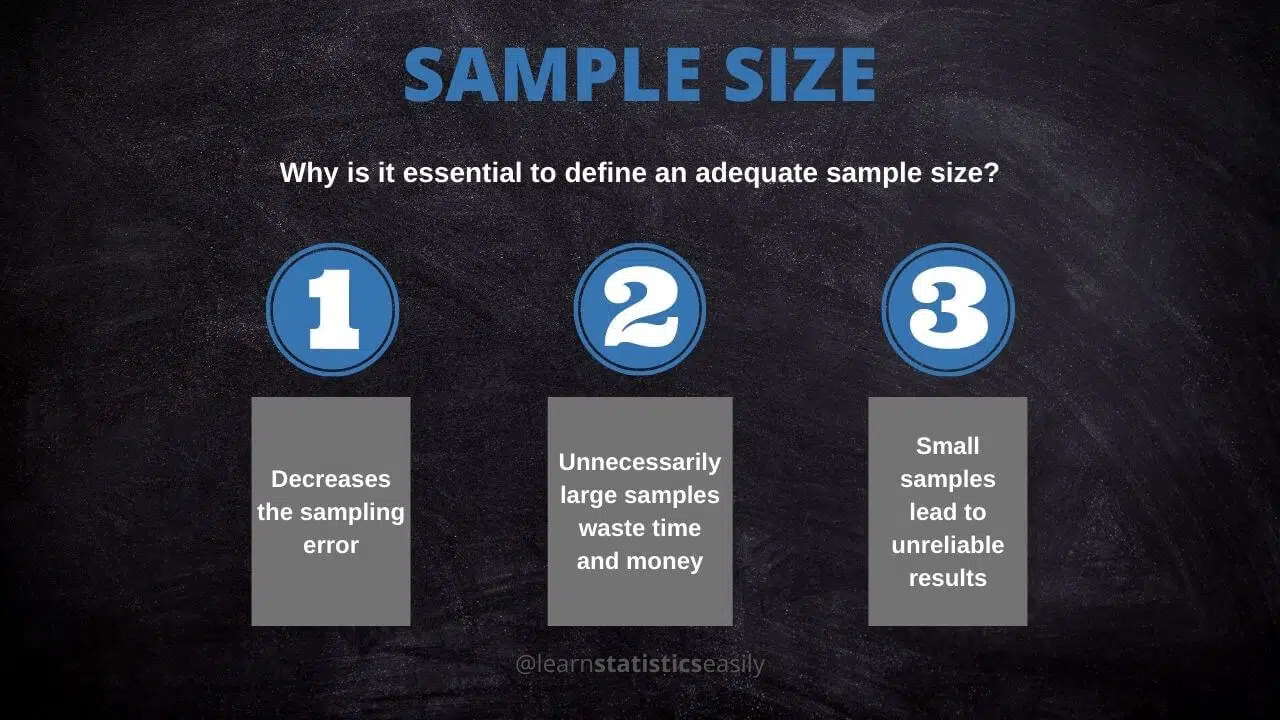
2. Calculating Sample Size for ANOVA
Upon determining the type of ANOVA you will employ, the next step involves determining the number of subjects needed for your study.
Achieving a suitable sample size often mitigates many statistical issues.
To ascertain the appropriate sample size for your test, you must perform a specific calculation, which varies between statistical tests.
For ANOVA, you will require an approximate or estimated mean and standard deviation for each population under study.
These values are input into a sample size calculator within your statistical software, aligned with the chosen ANOVA type.
The software then provides the optimal number of subjects to be collected.
But where do these means and standard deviations come from?
Typically, they are derived from prior pilot studies or similar research endeavors.
Pro tip: G*Power is a stellar, free statistical software that can be used to calculate the sample size.
3. The observations must be independent!
The independence of observations is the most significant statistical assumption, yet it is often overlooked.
This assumption is crucial for all statistical tests, including ANOVA, because violating it can lead to biased analyses and misleading results.
To maintain independence, ensure that each element of your sample is independent.
The concept of randomness is key here; collecting your data randomly from a suitable population for your study can help uphold this assumption.
For example, a random sample of individuals within the city should be used to identify a city’s genetic profile. Sampling only from one family, for example, would violate the independence assumption since their genetic profiles would be closely related.
4. Normality of the residuals
All parametric inferential analyses, including ANOVA, require normality assumption for residuals (errors).
Your residuals must conform to a normal (or Gaussian) distribution.
Statistical tests, such as the Shapiro-Wilk, Anderson-Darling, and Kolmogorov-Smirnov tests, can help ascertain whether your residuals fit this distribution.
Be careful when interpreting these tests’ results; if they indicate a violation of the normality assumption, consider the following options:
-
Proceed with the ANOVA, asserting that it is robust against deviations from normality, provided your sample size is adequate.
-
Transform your data and retest for normality.
-
Opt for a non-parametric equivalent to the t-test.
While the first option may seem convenient, it isn’t generally advised.
Typically, the second option is pursued; if the assumption of normality continues to be violated, the third option is recommended.
Parametric tests and their nonparametric equivalents:
- One-way ANOVA = Kruskal-Wallis H-test.
- One-way repeated measures ANOVA = Friedman’s Test
5. Homoscedasticity of the residuals
This step is only necessary after the residuals conform to the normality assumption.
Homoscedasticity refers to the requirement for similar or homogeneous variances among the sampled populations.
Various tests, such as the F, Bartlett’s, and Levene’s tests, can check for violations of this assumption.
However, a violation of this assumption usually is manageable.
If your data present heteroscedasticity (unequal variances), you can run the ANOVA with a minor adjustment (Welch).
Most statistical programs’ analysis reports automatically provide this adjusted ANOVA result.
6. ANOVA and post hoc tests
A significant p-value in the ANOVA indicates at least one pair of different means.
However, it does not specify which pair or pairs are different.
Post hoc tests (a posteriori tests) are used to determine which groups are significantly different.
Depending on whether variances are equal (homoscedastic) or unequal (heteroscedastic), different post hoc tests are used.
When assuming equal variances, commonly used tests include Tukey’s (HSD), Bonferroni, Scheffé, and Duncan’s tests.
The Games-Howell test, Tamhane’s T2 test, Dunnet’s T3 test, and Dunnet’s C test are often employed for unequal variances.
Concluding Remarks
ANOVA is one of the most widely used inferential statistical analyses globally.
Still, its misuse in many studies has led to questionable results and conclusions.
You can conduct a more robust and reliable analysis by following the six steps we outlined. Remember to:
- Choose the correct type of ANOVA,
- Calculate the appropriate sample size,
- Ensure proper random sampling,
- Check the normality of residuals,
- Confirm the homoscedasticity assumption, and
- Perform the ANOVA and subsequent post hoc test.
Recommended Articles
Are you prepared to explore further into statistics and data analysis? Check out our other informative articles on related topics in our blog. Expand your knowledge and sharpen your skills by exploring valuable insights and expert tips. Click here to start your learning journey now!
Frequently Asked Questions (FAQs)
Q1: What is ANOVA? It’s a statistical test that compares the means of two or more groups.
Q2: What are the most common types of ANOVA? The most common types are One-Way ANOVA and Repeated Measurements ANOVA.
Q3: How is the sample size determined for ANOVA? It requires estimated means and standard deviations from each population studied, calculated through statistical software.
Q4: What is the significance of the independence of observations in ANOVA? It’s a critical assumption in ANOVA. Violation of this can bias the analysis and yield misleading results.
Q5: What is meant by the normality of residuals in ANOVA? It means the residuals (errors) must follow the normal distribution. This is necessary for parametric inferential analyses.
Q6: How can we check the normality of residuals? This can be verified using normality tests such as Shapiro-Wilk, Anderson-Darling, and Kolmogorov-Smirnov.
Q7: What is Homoscedasticity in ANOVA? It means the variances of the sampled populations must be similar to apply standard ANOVA.
Q8: What happens if ANOVA’s p-value is significant? Post hoc tests can identify which groups are different if it’s significant.
Q9: What is the common mistake made in using ANOVA? Misuse of ANOVA is common, often leading to questionable study conclusions.
Q10: How to properly use ANOVA? By following the six steps: choose ANOVA type, calculate sample size, do random sampling, check residuals’ normality, check homoscedasticity, and run ANOVA with post hoc tests.