Left-Skewed and Right-Skewed Distributions: Understanding Asymmetry
You will learn the Impact of Left-Skewed vs Right-Skewed Distributions on Data Interpretation and Analysis.
Introduction
Understanding the nature of data distribution is fundamental in statistics and data analysis. At its core, data distribution is a reflection of how values are spread out across a range. This spread of values is essential to grasp as it directly influences the conclusions drawn from the data.
Skewness, a key concept in statistical analysis, plays a pivotal role in understanding data distributions. Skewness refers to the degree of asymmetry observed in a probability distribution. It’s a measure that reveals whether the data points are piled up on one side of the distribution’s scale (either left or right), affecting the tail’s length and direction.
Recognizing the type of skewness — whether left-skewed or right-skewed — is crucial in statistical analysis. This understanding impacts how we interpret data, test hypotheses, and make predictive models. Skewness, thus, is not merely a statistical characteristic but a window into the deeper structure and tendencies of the data. Its significance lies in its capacity to guide analysts and researchers in making informed, accurate interpretations and decisions based on the data. This is especially relevant in fields where data-driven insights are foundational.
This guide will explore the intricacies of left-skewed and right-skewed distributions, exploring their characteristics, implications, and profound impact on data analysis. Our journey through these concepts will enhance our statistical understanding and appreciation of data stories’ inherent beauty and truth.
Highlights
- Skewness measures asymmetry in distributions, critically influencing data analysis.
- Left-skewed data often indicates a spread of lower values; right-skewed shows a spread of higher values.
- Identifying skewness requires tools like histograms and statistical software.
- Addressing skewness includes data transformation and non-parametric statistical methods.
- Skewness applications range from finance and economics to natural sciences and public health.
Ad Title
Ad description. Lorem ipsum dolor sit amet, consectetur adipiscing elit.
Fundamentals of Skewness
In statistical terms, skewness measures the asymmetry of the probability distribution of a real-valued random variable about its mean. In simpler terms, it quantifies how much a distribution deviates from a normal distribution. A distribution is symmetrical if it looks the same to the left and right of the center point.
Definition and Types of Skewness
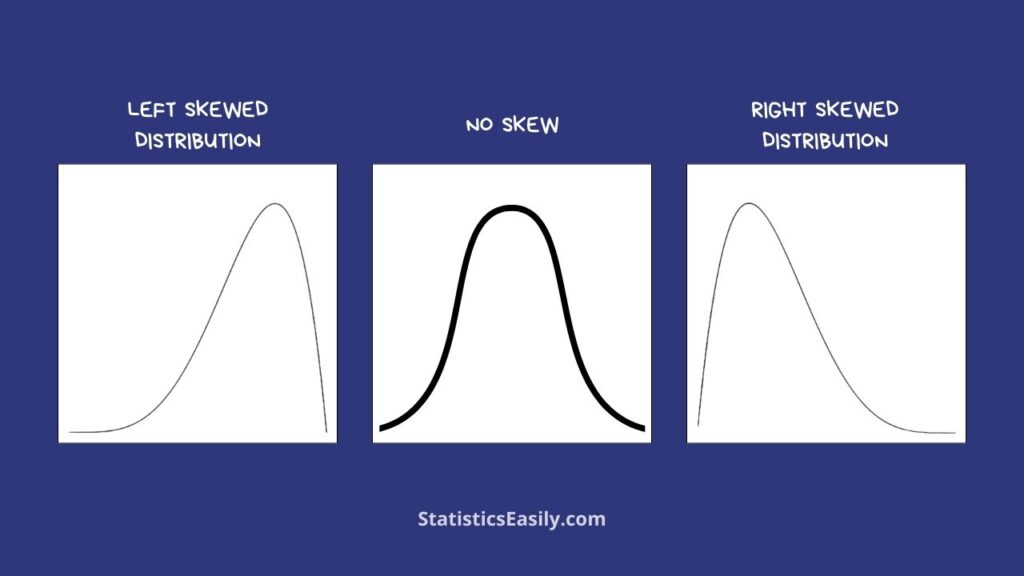
There are two main types of skewness — left-skewed (negatively skewed) and right-skewed (positively skewed). In a left-skewed distribution, the tail on the left side of the probability distribution is longer or fatter than the right. Conversely, the right tail is more prolonged or fatter in a right-skewed distribution. This skewness is a fundamental concept in understanding the data distribution as it affects the dataset’s mean, median, and mode.
Significance in Data Interpretation
Understanding skewness is critical for several reasons. First, it affects the choice of the appropriate model for data analysis. For example, right-skewed distributions are standard in financial data, which can impact investment strategies. Second, skewness affects how we approach central tendency measures — the mean might not be the best representation of central tendency in skewed distributions. Third, knowing the type of skewness helps choose the proper statistical tests and understand the potential biases in data interpretation.
Implications of Skewness
Skewness is more than just a statistical measure — it offers a deeper insight into the data’s nature. For instance, understanding the skewness of rainfall data in environmental science can be crucial for predicting extreme weather events. In medicine, skewed data can influence the interpretation of clinical trials and affect patient care decisions. Thus, skewness is not only about numbers; it’s about grasping the underlying reality that data represents, aligning with the pursuit of accuracy and meaning in applying statistics.
Left-Skewed Distributions
Definition and Characteristics
A left-skewed distribution, also known as a negatively skewed distribution, is one in which most data points are concentrated to the right of the mean, with the tail extending towards the left side. In these distributions, the mean is typically less than the median, and the mode is the highest point of the distribution. This leftward skewness indicates that the lower values of the data set are more spread out than the higher values.
Real-World Examples
Left-skewed distributions are often encountered in real-world scenarios. For instance, age at retirement is typically left-skewed. Most people retire at an age clustered around a standard range (say 60-70 years), but some retire much earlier, creating a long tail to the left. Another example is the time taken by students to complete a complicated exam. Most students might use nearly all the allotted time. Still, a few could finish quickly, creating a left-skewed distribution.
Implications in Statistical Analysis
Understanding left-skewed distributions is crucial in statistical analysis for several reasons:
- It informs the choice of statistical methods; standard methods that assume normality (symmetrical distribution) may not be suitable.
- It affects how we interpret measures of central tendency. In left-skewed distributions, the long left tail pulls the mean and is less than the median. This can lead to misinterpretations if one only considers the mean.
- Recognizing and adjusting for left skewness can improve the accuracy of predictive models and statistical inferences, ensuring that conclusions drawn from data reflect the underlying truth and are not skewed by outliers or anomalies.
Right-Skewed Distributions
Definition and Characteristics
Right-skewed distributions, also known as positively skewed distributions, are characterized by a majority of data points being clustered to the left of the mean, resulting in a long tail extending towards the right. In such distributions, the mean is typically greater than the median, and the mode is often the peak of the distribution. This rightward skewness implies that the higher values in the data set are more spread out than the lower values.
Real-World Examples
Right-skewed distributions are commonly observed in various fields. For example, household income is typically right-skewed, with most households earning below the average income but a few high earners pulling the mean upwards. Similarly, the distribution of property prices in a city is often right-skewed, where most properties are priced below the mean, but luxury properties significantly increase the average.
Implications in Statistical Analysis
Recognizing right-skewed distributions is vital for accurate statistical analysis:
- It necessitates using specific analytical techniques, as standard statistical methods assuming normality may lead to incorrect conclusions.
- It impacts the interpretation of central tendency measures; in right-skewed distributions, the mean is influenced by the high-value outliers and may not accurately represent the typical data point.
- Understanding the right skewness is crucial for selecting appropriate statistical tests and accurately modeling data. This ensures that the derived insights reflect the underlying trends and are not distorted.
Comparing Left-Skewed and Right-Skewed Distributions
Side-by-Side Comparison of Characteristics
Understanding the differences between left-skewed and right-skewed distributions is essential for accurate data interpretation and analysis. Here’s a side-by-side comparison:
- Shape: In left-skewed distributions, the tail is longer on the left side, while in right-skewed distributions, the tail is longer on the right side.
- Mean, Median, and Mode: For left-skewed distributions, the mean is less than the median, which is less than the mode. The reverse is true for right-skewed distributions, where the mean is greater than the median and greater than the mode.
- Data Concentration: In left-skewed distributions, data are more spread out on the lower end, and in right-skewed distributions, data are more spread out on the higher end.
- Examples: Left-skewed distributions include age at retirement, while right-skewed examples include household income and property prices.
Impact on Data Interpretation and Decision-Making
The skewness of distribution significantly affects data interpretation and decision-making in several ways:
- Model Selection: The type of skewness in a dataset influences the choice of statistical models and tests. Models that assume normality might not be appropriate for skewed data.
- Data Transformation: Understanding skewness can guide whether data transformation is necessary to normalize the distribution, which is crucial for many statistical tests and models.
- Risk Assessment: In finance and economics, skewness affects risk assessment. Right-skewed distributions in investment returns can signify higher potential returns and greater risk.
- Policy Making and Planning: In fields like public health or urban planning, recognizing skewness can inform policy decisions. For instance, skewed data on healthcare access can guide resource allocation.
- Insight into Data Sources: The type of skewness can provide insights into underlying processes or data collection methods. It helps in identifying outliers or biases in data collection.
- Communication of Findings: Proper understanding of skewness ensures accurate communication of data findings. Misinterpreting skewness can lead to incorrect conclusions, affecting the credibility and effectiveness of decisions based on the data.
Identifying Skewness in Data
Tools and Techniques for Detecting Skewness
Identifying skewness in data is crucial for accurate statistical analysis. Various tools and techniques are employed for this purpose:
- Numerical Measures: Skewness can be quantitatively measured using statistical formulas. The skewness coefficient, for instance, is a number that describes the degree of asymmetry of a distribution around its mean. A skewness value greater than 0 indicates right skewness, while a value less than 0 indicates left skewness. A value close to 0 suggests a nearly symmetrical distribution.
- Software and Programming: Modern statistical software and programming languages like R, Python, and SPSS offer built-in functions to calculate skewness. These tools are invaluable for handling large datasets where manual calculation is impractical.
- Data Transformation Techniques: Sometimes, data transformation methods like logarithmic, square root, or Box-Cox transformations are used to reduce skewness in a dataset, making it more suitable for certain types of statistical analysis.
The Role of Visual Aids
Visual aids play a significant role in identifying skewness:
- Histograms: Histograms are one of the most straightforward visual tools for detecting skewness. By plotting the frequency of data points, histograms can show the distribution’s shape, revealing any skewness. A left-skewed distribution will have a longer tail on the left, and a right-skewed distribution will have a longer tail on the right.
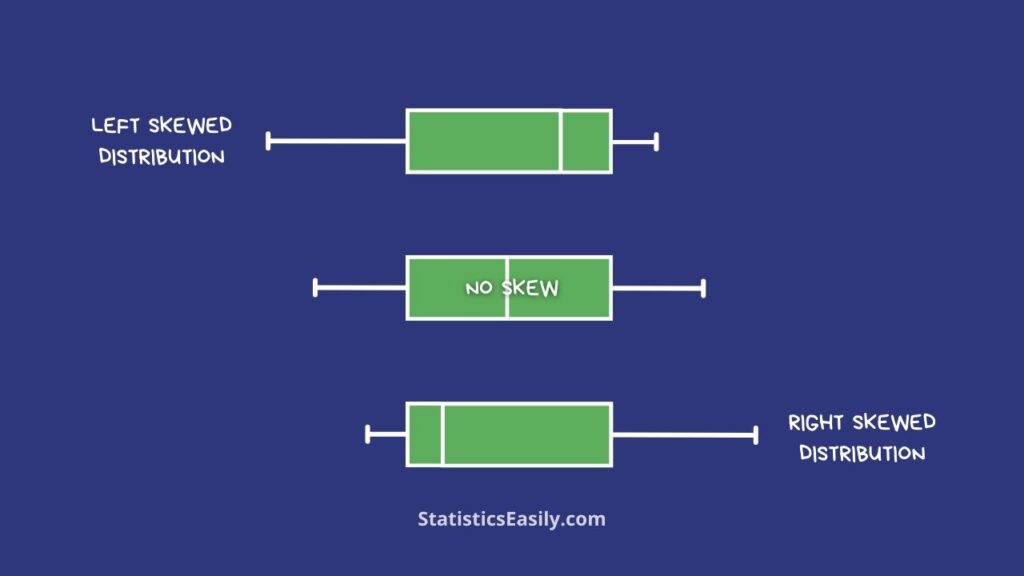
- Box Plots: Box plots, or box-and-whisker plots, provide a visual representation of the distribution’s quartiles, median, and outliers. Skewness is indicated by the asymmetry in the box plot, where one ‘whisker’ may be longer than the other, or the median might not be centered in the box.
- Scatter Plots: Scatter plots can be helpful for bivariate data to visualize patterns and potential skewness in the relationship between two variables.
- Q-Q Plots (Quantile-Quantile Plots): Q-Q plots compare the quantiles of a distribution with a normal distribution. Deviations from the straight line in a Q-Q plot indicate skewness.
Using these tools, researchers and analysts can effectively identify skewness in their data, enabling them to choose appropriate analytical techniques and draw more accurate conclusions. Understanding skewness is not just a statistical requirement but a step towards unveiling the truth in data, aligning with the noble pursuit of truth, goodness, and beauty in data analysis. Recognizing and addressing skewness ensures that our interpretations and decisions are grounded in a realistic understanding of the data’s underlying structure and characteristics.
Addressing Skewness in Data Analysis
Methods for Managing Skewed Data
Effectively managing skewed data is crucial for accurate analysis and interpretation. Here are some methods commonly used:
- Data Transformation: This is one of the most common approaches to address skewness. Transformations such as logarithmic, square root, or Box-Cox can normalize the distribution of the data, making it more symmetric. For instance, a logarithmic transformation is often effective for right-skewed data.
- Trimming or Removing Outliers: In some cases, eliminating outliers can reduce skewness. This method removes data points significantly higher or lower than the rest. However, it’s essential to consider the impact of this approach on the overall analysis, as it might lead to the loss of valuable information.
- Using Non-parametric Statistical Methods: These methods do not assume a normal distribution of data and can be more appropriate for skewed data. Examples include the Mann-Whitney U test or the Kruskal-Wallis test.
- Applying Different Analytical Techniques: Different statistical models may be more suitable depending on the skewness type and the data’s nature. For example, generalized linear models can be used instead of ordinary ones for skewed data.
When to Apply Transformations
Deciding when to apply transformations requires careful consideration:
- Severity of Skewness: Minor skewness might not significantly impact the analysis, whereas severe skewness often necessitates transformation.
- Type of Analysis Being Conducted: Some analyses, like specific regression models, are more sensitive to skewness than others. For these, even moderate skewness might require addressing.
- Nature of Data: In some fields, like specific natural sciences, transforming data can change its interpretability. In such cases, balancing the need for transformation with maintaining meaningful data is crucial.
- Distribution Requirements of Statistical Tests: Some statistical tests require normally distributed data. If the chosen test is sensitive to skewness, transformation might be necessary.
Applications of Skewness in Various Fields
Skewness in data distribution profoundly impacts various fields, each with unique implications and applications. Here are some examples:
Finance
- Investment Analysis: Right-skewed distributions are joint in investment returns, where the risk of significant losses often accompanies the potential for high returns. Understanding skewness helps in risk assessment and portfolio management.
- Credit Risk Modeling: Credit scoring models often deal with skewed data. Analyzing the skewness in repayment history helps predict defaults and manage credit risk more effectively.
Social Sciences
- Psychological Research: In psychology, response time data is often right-skewed. Researchers must consider this skewness when analyzing reaction times in cognitive experiments to draw accurate conclusions.
- Sociological Studies: Income and wealth distribution in populations typically exhibit right-skewness. Sociologists study this skewness to understand economic inequality and its societal impacts.
Natural Sciences
- Environmental Studies: Data on environmental factors like rainfall or pollutant levels often show skewness. Accurately analyzing this data is crucial for predicting weather patterns and assessing environmental risks.
- Biological Sciences: Measurements in biological studies, such as organisms’ sizes or growth rates, can be skewed. Understanding this skewness is essential for interpreting biological phenomena correctly.
Medicine and Public Health
- Clinical Trials: Patient response to treatments can have skewed distributions. Recognizing and addressing this skewness is essential in analyzing clinical trial data to ensure patient safety and treatment efficacy.
- Epidemiological Studies: In epidemiology, the spread of diseases often follows a skewed pattern. Understanding this skewness is vital for effective disease control and prevention strategies.
Business and Economics
- Consumer Behavior Analysis: Purchase frequencies and amounts often show skewness in retail and e-commerce. Businesses analyze this to understand consumer habits and tailor marketing strategies.
- Economic Forecasting: Economic data like GDP growth rates and unemployment figures can be skewed. Economists must consider this in their forecasts to provide accurate economic advice.
Ad Title
Ad description. Lorem ipsum dolor sit amet, consectetur adipiscing elit.
Conclusion
In this comprehensive exploration of left-skewed and right-skewed distributions, we’ve delved deep into the core concepts of skewness, its detection, management, and wide-ranging applications across various fields. We’ve seen how skewness is not merely a statistical characteristic but an insightful window into data’s deeper structure and tendencies. Whether data is left-skewed or right-skewed is critical in guiding analysts and researchers toward making informed and accurate interpretations and decisions.
Key Points Summarized:
- Definition and Importance: Skewness measures the degree of asymmetry in a probability distribution, significantly affecting data interpretation and decision-making.
- Identification Techniques: We discussed various tools and techniques, including numerical measures and visual aids like histograms and box plots, to detect skewness effectively.
- Management Strategies: Addressing skewness through data transformation, outlier management, and applying non-parametric methods ensures more accurate analysis.
- Applications in Various Fields: From finance to natural sciences, skewness has distinct implications, influencing everything from investment strategies to environmental studies.
The importance of understanding skewness in data cannot be overstated. It is fundamental to achieving a true and meaningful analysis, ensuring our conclusions and decisions reflect reality. Skewness is more than a statistical measure; it is a critical aspect of data that reveals the truth and facilitates better, more informed decision-making when properly understood and handled.
In essence, the study of skewness is a pursuit of truth, allowing us to see beyond mere numbers to the real stories data tells. By mastering the concepts of left-skewed and right-skewed distributions, we equip ourselves with the knowledge to harness the power of data in its most accurate form.
Recommended Articles
Are you interested in more insights on statistical analysis? Discover a wealth of knowledge in our blog’s other articles focused on advanced data interpretation techniques.
- Understanding Normal Distribution
- Which Normality Test Should You Use?
- The Misconception of Peakedness in Kurtosis
Frequently Asked Questions (FAQs)
Q1: What is skewness in statistical terms? Skewness quantifies the degree of asymmetry in a distribution, indicating how data deviates from the normal distribution.
Q2: How do left-skewed and right-skewed distributions differ? Left-skewed distributions have a longer tail on the left side, indicating a spread in lower values. Right-skewed distributions have a longer tail on the right, indicating a spread in higher values.
Q3: Why is understanding skewness important in data analysis? Recognizing skewness is vital for selecting appropriate statistical models and tests, ensuring accurate data interpretation and decision-making.
Q4: What tools are used to detect skewness in data? Tools like histograms, box plots, scatter plots, and Q-Q plots, along with statistical software, detect skewness.
Q5: When should data transformation be applied to address skewness? Data transformation should be considered when skewness significantly impacts the analysis or when specific statistical tests require normalized data.
Q6: Can skewness affect investment strategies in finance? Understanding skewness, especially right-skewed distributions, is crucial in finance for risk assessment and portfolio management.
Q7: How does skewness impact psychological research? In psychology, especially in reaction time studies, right-skewed data must be analyzed correctly to draw accurate conclusions.
Q8: What role does skewness play in epidemiological studies? Skewness in disease spread patterns is vital for effective disease control and prevention strategies in epidemiology.
Q9: Why is outlier management critical in skewed data? Outlier management helps in reducing skewness, leading to a more accurate representation of the central tendency and variability in data.
Q10: How does skewness influence economic forecasting? Skewness in economic data like GDP growth rates and unemployment figures must be considered for accurate economic forecasting.