
Understanding Normal Distribution: A Comprehensive Guide
A normal distribution is a statistical probability distribution characterized by a symmetrical bell-shaped curve centered around the mean. Its importance lies in accurately representing real-world data and enabling predictive analysis due to its predictable nature and mathematical properties.
The Definition of Normal Distribution
The normal distribution is a concept in statistics that describes a specific way in which data is spread out across a range. Also referred to as a Gaussian distribution or a bell curve, the normal distribution represents data in a pattern where most occurrences occur near the middle of the mean of the distribution.
The normal distribution is symmetrical, meaning that data is as likely to occur on one side of the average as on the other. It’s characterized by its bell-like shape, hence the term bell curve. This shape results from most observations clustering at the mean, with frequencies gradually reducing as you move away from the center.
In practical terms, a normal distribution presents a high frequency of data in the center (mean) that tapers off on either side. This pattern forms the characteristic bell shape and offers a handy way of quickly understanding a data set.

Highlights
- Normal distribution describes data spread around a central mean.
- It’s often depicted as a symmetric, bell-shaped curve.
- The mean, mode, and median have the same value in a normal distribution.
- A Q-Q plot can help identify normal distribution.
Ad Title
Ad description. Lorem ipsum dolor sit amet, consectetur adipiscing elit.
The 5 Properties of a Normal Distribution
The normal distribution is defined by five main properties:
Symmetry: The bell curve is symmetric around the mean, implying that data is equally distributed on both sides of the center.
Mean = Mode = Median: The mean, mode, and median in a normal distribution are all equal and situated at the center of the distribution.
Asymptotic: The tails of the normal distribution curve extend indefinitely without reaching the x-axis, suggesting that no matter how far from the mean, there’s always a possibility, albeit increasingly small, for a data point to exist.
Bell-shaped: The normal distribution graph is bell-shaped, with the highest point over the mean.
Dependence on Mean and Standard Deviation: The shape of the normal distribution is determined by the mean (μ) and the standard deviation (σ).
How to Identify Normal Distribution in Data
Identifying a normal distribution in data requires both visual inspection and statistical analysis. Visual inspection involves creating a data histogram, looking for the tell-tale bell curve shape that characterizes the normal distribution.
Apart from visually inspecting data, there are summary statistics that can assist in identifying normal distribution. These statistical measures are known as summary statistics.
Mean, Median, and Mode: These three measures of central tendency should be approximately equal in a normal distribution.
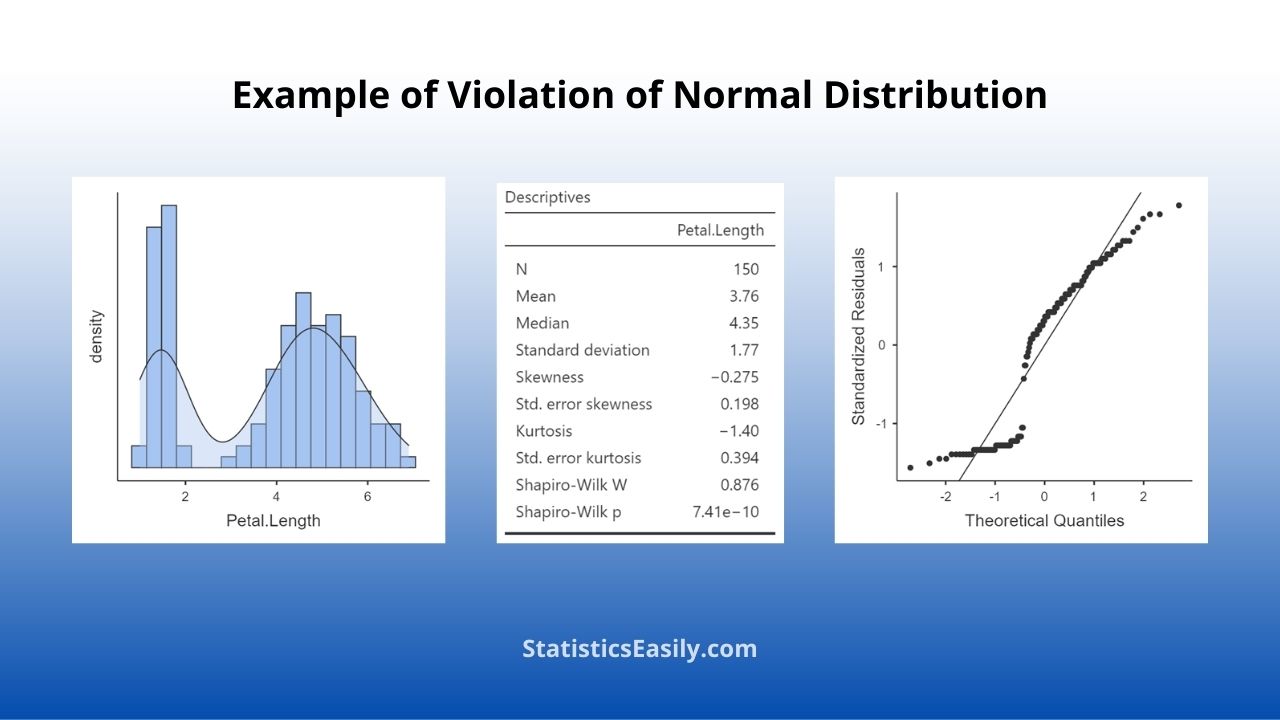
Skewness: This measure of the asymmetry of the probability distribution should be close to 0 in a normal distribution.
Kurtosis: This measure of the “tailedness” of the probability distribution should be close to 0 in a normal distribution, indicating a similar tailedness to the normal distribution.
Coefficient of Variation (CV): This standardized measure of dispersion should show low variability (up to 30%) in normally distributed data.
We have tests like the Shapiro-Wilk test on the more advanced side of statistical testing. This test checks the null hypothesis that a sample comes from a normally distributed population. Note that these tests are sensitive to sample size and might not always be reliable.
Lastly, the normal probability plot, also known as a Q-Q plot, can be used to identify normal distribution. This plot graphs the observed values against those expected under a normal distribution. The data is normally distributed when the points are in a normal straight line.

The Importance of Normal Distribution in Statistics
The normal distribution plays a vital role in statistics and natural sciences because it accurately describes various naturally occurring phenomena. It’s often used in social sciences to represent random variables in populations.
Moreover, the normal distribution is integral to hypothesis testing, a key component in statistical analysis. The Central Limit Theorem is a crucial principle in the field of statistics. It explains that when many independent and identically distributed random variables are added together, they tend to follow a normal distribution.
Real-life Examples of Normal Distribution
The normal distribution appears frequently in the real world. For example, size measures such as height, weight, and length often follow a normal distribution in a large population. Other common examples include blood pressure, marks on a test, and measurement errors.
The normal distribution is critical in quality control and risk management in the business world. For instance, businesses often use the normal distribution to predict future sales, inventory levels, and product returns.
Challenges: Why Data May Not Always Be Normally Distributed
Data may not always follow a normal distribution. Reasons for this could be underlying relationships between variables, skewness in the data, or the presence of outliers.
For example, income data are often not normally distributed because it has a lower zero limit, are usually positively skewed with a long tail to the right, and can include extreme values or outliers.
Data transformations or non-parametric statistical methods often allow statistical analysis in these situations.
Ad Title
Ad description. Lorem ipsum dolor sit amet, consectetur adipiscing elit.
Recommended Articles
Take advantage of our other articles exploring related topics! Explore the field of data science in more depth by checking out our blog.
- Generalized Linear Models (Story)
- Which Normality Test Should You Use?
- How to Calculate the Median in Excel – Simple Steps
- Measures of Central Tendency: Mean, Mode, Median
- Standard Normal Distribution – an overview (External Link)
- Kaplan-Meier Survival Analysis in R: Mastering Time-to-Event Data
- Generalized Linear Model (GLM) Distribution and Link Function Selection Guide
Frequently Asked Questions (FAQ)
It’s a pattern in which data is symmetrically distributed around the mean, forming a bell-shaped curve.
The properties include symmetry, equal mean, median, mode, and asymptotic nature.
Inspecting a histogram and conducting statistical tests like the Shapiro-Wilk test or analyzing a Q-Q plot.
Yes, they are interchangeable terms in statistics.
It’s vital in statistics for predicting real-world phenomena and aiding in hypothesis testing.
Examples include height, weight, and test scores in large populations.
Yes, it’s like a highest-frequency bin in the middle, with frequencies tapering off evenly towards the ends.
Data may not always be normal due to skewness, outliers, or underlying relationships between variables.
Shapiro-Wilk and Anderson-Darling tests are standard statistical methods to verify whether a data set is normally distributed.
If data is not normally distributed, it may violate assumptions of specific statistical tests, which may require data transformations or non-parametric methods.