
The Misconception of Peakedness in Kurtosis
You will learn the historical background of kurtosis and how its meaning has evolved over time, clarifying misconceptions about peakedness.
Introduction
Kurtosis, derived from the Greek word “kyrtos,” which means “curved” or “arched,” is a measure used to describe the shape of a distribution. It focuses on the distribution’s tails and provides insights into the presence of extreme values or outliers. Traditionally, kurtosis has been associated with peakedness, referring to the shape of the peak of a distribution. However, this notion must be clarified, as kurtosis does not seem to provide important information about the peak. A higher kurtosis value is often thought to indicate a sharper peak. In comparison, a lower kurtosis value would suggest a flatter peak. But, as we will see, this understanding is not entirely accurate.
Highlights
- Neither small nor large kurtosis provides helpful information about the shape of the peak of a distribution.
- Distributions with small or large kurtosis can have different peak shapes, such as flat, pointy, or bimodal.
- Kurtosis is primarily determined by the tails of a distribution rather than its peak.
- The relationship between kurtosis and peakedness is not valid and should be dismissed.
Ad Title
Ad description. Lorem ipsum dolor sit amet, consectetur adipiscing elit.
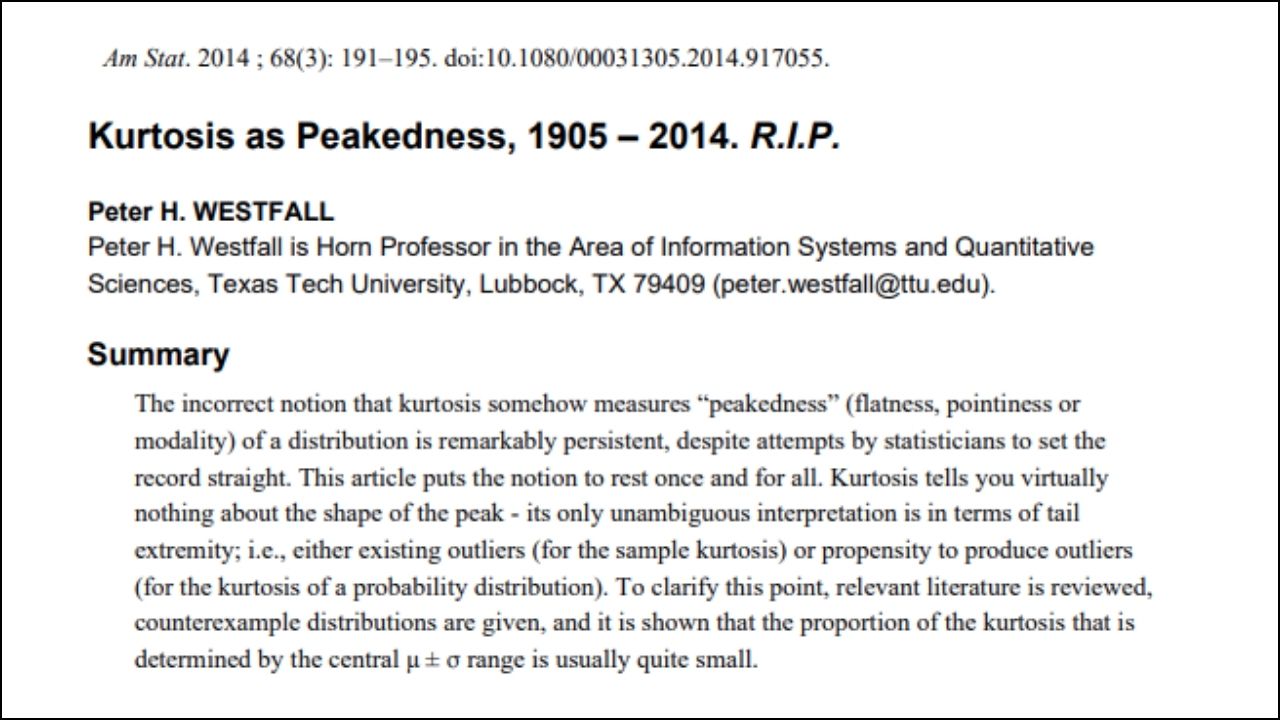
The Kurtosis Study: A Brief Overview
This section will provide an overview of the influential study conducted by Peter H. Westfall, titled “Kurtosis as Peakedness, 1905 – 2014. R.I.P.“
The paper effectively challenges the long-standing misconception that kurtosis is a measure of peakedness in a probability distribution.
Author: Peter H. Westfall, a renowned statistician and professor examined the misunderstood concept of kurtosis. With his expertise in the field, he was able to provide valuable insights and dispel the myth that kurtosis is a measure of peakedness.
Objective: The primary aim of Westfall’s study was to debunk the misconception that kurtosis is related to peakedness in a probability distribution. The paper aims to demonstrate that kurtosis does not provide any helpful information about the shape of a distribution’s peak and should not be defined in terms of peakedness.
Methodology: Westfall approached this objective by analyzing distributions with different kurtosis values, such as small kurtosis (κ = 2.4) and large kurtosis (κ ≈ 6,000). He then presented compelling evidence through examples of distributions with identical kurtosis but widely different peaks. Westfall also provided upper bounds on the proportion of kurtosis determined by the center for general distributions, demonstrating that kurtosis is primarily determined by the tails of a distribution.
Debunking the Kurtosis Misconception
Ineffective as a Measure of Peakedness: Through extensive research, Westfall demonstrated that kurtosis is not an adequate measure of peakedness in a distribution. He presented various examples of distributions with identical kurtosis values but significantly different peaks, effectively showing that kurtosis alone does not provide meaningful information about the shape of a distribution’s peak.
Small and Large Kurtosis Values: Westfall explored the implications of both small and large kurtosis values on the shape of a distribution’s peak. He provided compelling examples that small kurtosis values (κ = 2.4) and large kurtosis values (κ ≈ 6,000) do not reveal anything about the peak of distribution, whether it is flat, pointy, or bimodal.
The True Purpose of Kurtosis
Measuring Tail Behavior: Contrary to the widespread misconception, kurtosis measures the tail behavior in a probability distribution. It indicates how heavy or light the tails are compared to a normal distribution, giving insights into the distribution’s propensity for extreme values or outliers.
Comparing Distributions: Kurtosis can compare different distributions concerning their tail behavior. By analyzing kurtosis values, statisticians can better understand the risks and characteristics associated with various distributions, which is especially useful in finance and risk management contexts.
Identifying Outliers: Since kurtosis focuses on tail behavior, it can help identify the presence of outliers in a dataset. For example, distributions with high kurtosis values often indicate a higher likelihood of extreme values. In contrast, low kurtosis values suggest a lower risk of outliers.
Assessing Normality: Although kurtosis is not a definitive test for normality, it can be used as a supplementary tool in assessing the normality of a distribution. In combination with other statistical measures like skewness and the Shapiro-Wilk test, kurtosis can provide additional insights into the underlying distribution of a dataset.
Ad Title
Ad description. Lorem ipsum dolor sit amet, consectetur adipiscing elit.
Conclusion
While exploring its true purpose and applications, we have delved into the commonly held misconception of kurtosis as a peakedness measure. Through Westfall’s research, we have demonstrated that kurtosis is a measure of the tail behavior of a probability distribution, providing valuable insights into the distribution’s propensity for extreme values and outliers. By debunking the misconception of peakedness, we can foster a deeper understanding of kurtosis and its practical implications in various fields, such as finance, risk management, and data analysis. A clear understanding of the true purpose of kurtosis enables analysts and researchers to make more informed decisions when building statistical models and comparing different distributions. Recognizing the limitations of outdated definitions and misconceptions in statistics is essential. Embracing the accurate interpretation of kurtosis as a measure of tail behavior promotes statistical literacy and paves the way for more precise and practical applications of this important concept in data analysis and decision-making.
Recommended Articles
- Kurtosis: Beyond Peakedness (Story)
- Which Normality Test Should You Use?
- Standard Deviation Demystified (Story)
- T-Test vs Z-Test: Key Differences (Story)
- Exploring Right-Skewed Histograms in Data Analysis
- Histogram Skewed Right: Unveiling the Truth Behind Asymmetrical Data
- Left-Skewed and Right-Skewed Distributions: Understanding Asymmetry
Frequently Asked Questions (FAQ)
Kurtosis is a statistical measure used to describe the distribution of data points in the tails of a frequency distribution. It indicates how heavy or light the distribution’s tails are compared to a normal distribution.
Historically, kurtosis has been mistakenly associated with the peakedness of distribution due to early definitions. However, kurtosis measures tail heaviness, not the peakedness of the central part of the distribution.
High kurtosis indicates a distribution with heavier tails and more frequent extreme values, suggesting a greater propensity for producing outliers than a normal distribution.
Low kurtosis suggests a distribution with lighter tails and fewer extreme values, making it less likely to produce outliers than a normal distribution.
No, kurtosis does not provide meaningful information about the peakedness of a distribution’s peak. It focuses solely on the tail behavior and the presence of outliers.
Kurtosis is helpful in fields like finance and risk management for comparing different distributions, assessing the risk of extreme values, and understanding the tail behavior of financial returns.
A common misconception is that kurtosis measures the peakedness of a distribution. In reality, kurtosis assesses the extremeness of data points in the tails.
Peter H. Westfall’s study debunked the long-standing misconception that kurtosis measures peakedness, demonstrating through analysis that kurtosis primarily measures tail heaviness.
Correcting this misconception allows statisticians and researchers to use kurtosis correctly to analyze distributions, particularly to assess the likelihood of outliers, which improves decision-making in risk-sensitive environments.
While kurtosis measures the heaviness of a distribution’s tails, skewness assesses the asymmetry or the degree to which a distribution leans to one side. Both describe the shape of data distributions but focus on different aspects.


Nice summary. See also https://stats.stackexchange.com/q/659400/102879
Thank you very much, Dr. Westfall. It’s an honor to receive your comment. Your article was the cornerstone of this post, and I’m truly grateful for your work in clarifying this often-misunderstood topic. I’ve added the StackExchange link you shared to complement the discussion. Your contribution continues to guide many of us in the field of statistics. Thank you again!