The Power of Mind Mapping with ChatGPT
You will learn how to harness the capabilities of AI and ChatGPT for innovative mind mapping in statistics and data analysis, enhancing the organization, visualization, and communication of complex data.
Introduction
In the modern era where data reigns supreme, Artificial Intelligence (AI) and its applications like mind mapping are transforming data analysis and statistics. Mind mapping, enhanced by AI technologies like ChatGPT, is revolutionizing how we organize and visualize complex data, moving beyond traditional methods to offer a more dynamic and intuitive understanding of statistics. This integration of AI not only simplifies intricate statistical concepts but also amplifies the efficiency and effectiveness of communication in data analysis. As we delve into the capabilities of AI-driven tools like ChatGPT, this article will guide you through creating mind maps, their statistics applications, and the benefits and challenges of the innovative approach, highlighting a new paradigm in statistical exploration and communication.
Highlights
- AI and ChatGPT transform statistical data analysis by enabling dynamic and intuitive visualization through mind mapping.
- ChatGPT simplifies creating mind maps, facilitating a better understanding of complex statistical concepts and workflows.
- Mind maps in statistics help visually organize multifaceted data sets, enhancing comprehension and decision-making.
- ChatGPT’s mind maps improve communication in statistics, making complex data accessible to a broader, non-expert audience.
- Despite potential challenges, strategic solutions maximize the effectiveness of ChatGPT in statistical mind mapping.
What is ChatGPT?
ChatGPT, developed by OpenAI, represents a significant advancement in AI, especially in natural language processing. It’s a sophisticated language model that excels in understanding, interpreting, and generating human-like text, making it a valuable asset in data analysis and statistics. ChatGPT’s Transformer-based architecture enables it to simulate human conversations, providing in-depth discussions and explanations on complex topics. Its unique capability to accurately handle queries related to statistics and data analysis sets it apart. Particularly in mind mapping, ChatGPT simplifies creating visual representations of complex data, enhancing data organization, understanding, and communication in statistical analysis.
ChatGPT and Mind Mapping in Data Analysis
One of the most intriguing applications of ChatGPT in statistics and data analysis is its ability to assist in creating mind maps. A mind map is a visual representation of information structured to mirror the natural thinking process. In statistics, mind maps can organize complex data sets, illustrate relationships between different statistical variables, or even outline the steps in data analysis workflows.
The process of creating a mind map with ChatGPT is straightforward yet innovative. By simply providing a command or topic related to statistics or data analysis, ChatGPT can generate the structure and content of a mind map. This capability simplifies the process of organizing and visualizing complex data. It enhances the overall understanding and communication of statistical findings. With ChatGPT’s assistance, statisticians and data analysts can create comprehensive, easy-to-understand visual representations of their data, making the analysis process more efficient and effective.
The Process of Mind Mapping with ChatGPT
Creating a mind map with ChatGPT is an engaging process that combines the power of AI with the simplicity of user interaction. Let’s refine the previous steps to provide a more detailed guide.
Step 1: Access and Login to ChatGPT
The initial step in harnessing the capabilities of ChatGPT for mind mapping begins with accessing the tool. Navigate to the ChatGPT website or app and log in to your account. If you’re a new user, the process is straightforward — sign up to create an account. This step is essential as it connects you to the AI’s extensive knowledge base and interactive capabilities.
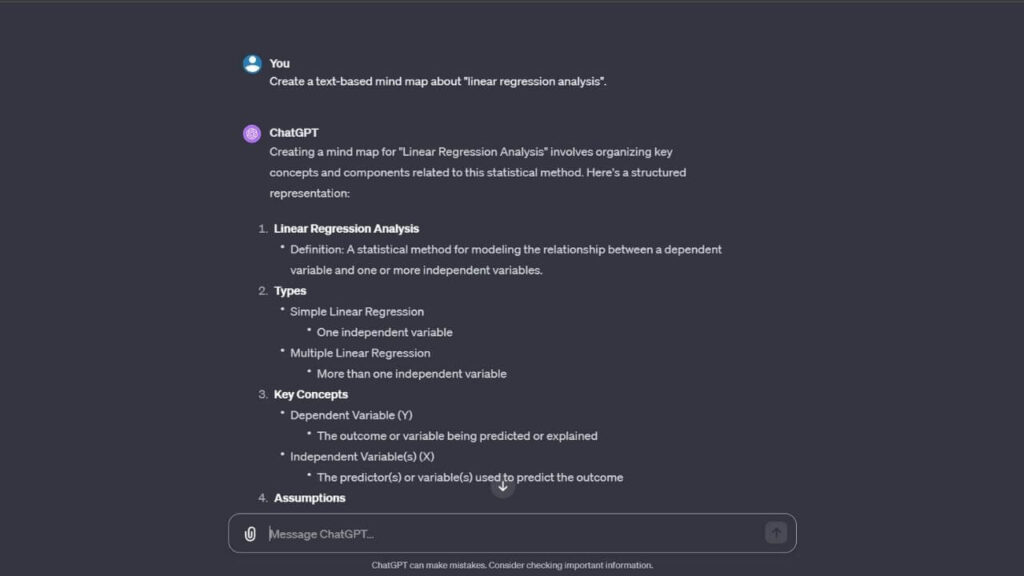
Step 2: Prompting ChatGPT for Mind Map Creation
Once logged in, move to the messaging area. Here, you will interact with ChatGPT to initiate the creation of your mind map. Enter the command: “Create a text-based mind map about [topic],” substituting “[topic]” with your desired subject in statistics or data analysis. This prompt sets the stage for ChatGPT to begin crafting the structure of your mind map based on the topic you provide.
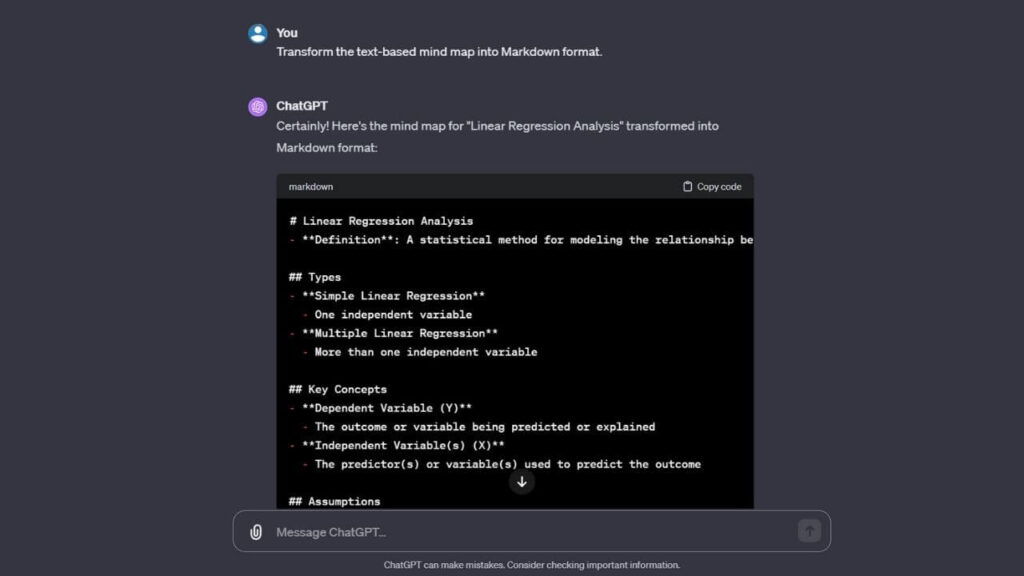
Step 3: Converting the Mind Map to Markdown Format
After ChatGPT presents the initial structure of your mind map, the next step involves converting this into a more usable format. Ask ChatGPT to “Transform the text-based mind map into Markdown format.” This command prompts ChatGPT to reformat the mind map into Markdown, a lightweight markup language, making it easy to handle and modify. Once transformed, the “Copy node” function copies the entire Markdown code.
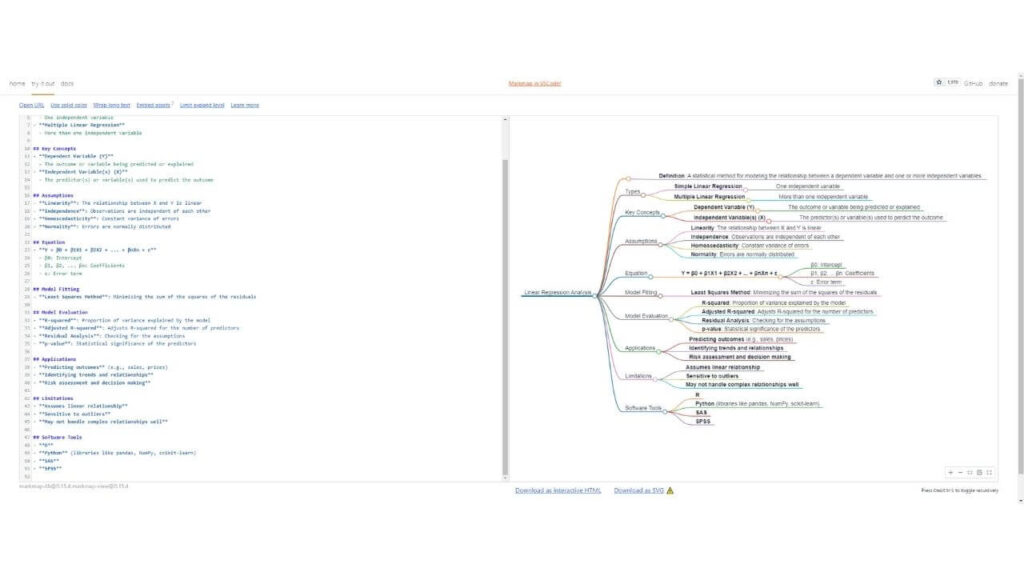
Step 4: Utilizing Markmap for Visualization
With your Markdown-formatted mind map in hand, visit the Markmap website. This tool allows you to visualize the mind map effectively. Clear any existing demonstration code on the site and paste your Markdown text from ChatGPT. Markmap will then render your mind map, bringing the structured data to life in a visually appealing and interactive format.
Final Step: Download and Utilize Your Mind Map
The final step is to download your newly created mind map. On the Markmap site, you can download the mind map as an SVG file. This format ensures that your mind map is available in a high-quality visual format for presentations, reports, or further analysis.
Mind Mapping in Statistics and Data Analysis
Using mind maps in statistics and data analysis is a game-changer, simplifying complex concepts and workflows. Let’s explore how this tool can be effectively utilized in various statistical scenarios.
Simplifying Complex Statistical Concepts
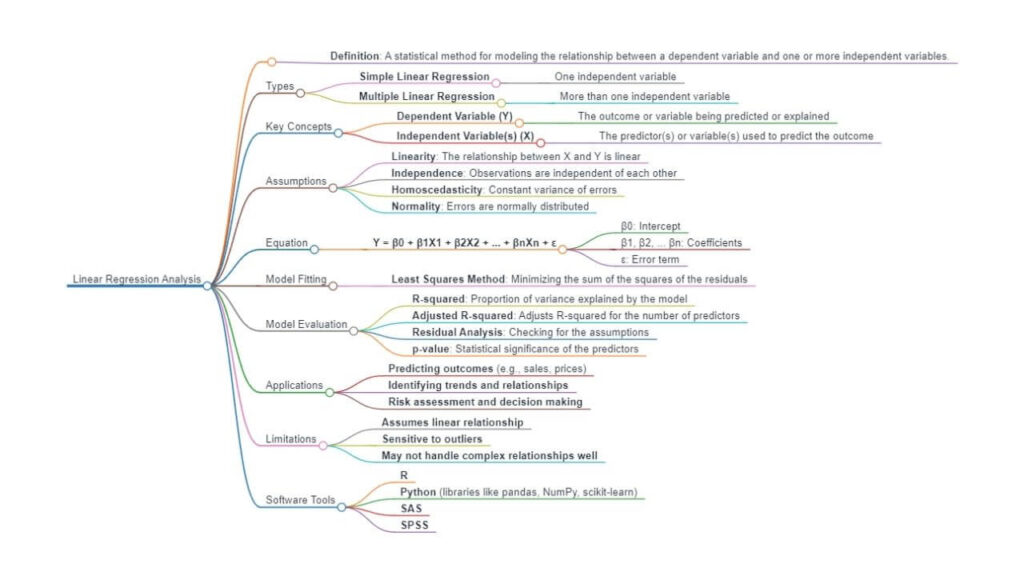
Mind maps are adept at breaking down intricate statistical concepts into more understandable segments. Take, for instance, linear regression analysis. A mind map can visually delineate the process, starting from the basic definition, moving through the assumptions, and detailing the steps of performing regression analysis, including data collection, model fitting, and interpretation of results. This visual representation helps grasp the concept holistically, ensuring a deeper understanding of each component.
Another example is the area of probability and hypothesis testing. A mind map can effectively chart out the workflow of hypothesis formulation, detailing the selection of appropriate tests, conducting the tests, and interpreting p-values and confidence intervals. This approach not only simplifies the understanding but also assists in retaining and recalling the information more efficiently.
Enhancing Data Analysis Workflows
Mind maps are also invaluable in organizing and streamlining data analysis workflows. A mind map can provide a clear roadmap for complex projects involving multiple stages of data processing and analysis. It can visually represent the sequence of actions from data collection, cleaning, and preprocessing to applying analytical methods and interpreting results.
Mind maps can serve as a planning tool in the context of data visualization techniques. They can help identify the key data points, choose the most effective types of visualizations (like bar charts, scatter plots, or heat maps), and plan the layout and presentation of the final visualization. This not only enhances the effectiveness of the data presentation but also ensures that the visualizations are aligned with the overall objectives of the analysis.
Bridging the Communication Gap
Finally, mind maps effectively bridge the communication gap between statisticians, data analysts, and stakeholders. They provide a visual language more easily understood by non-experts, facilitating better discussions, brainstorming sessions, and collaborative decision-making processes. This is particularly important in interdisciplinary teams where members may have differing levels of expertise in statistical methods.
Benefits of Using Mind Maps in Statistics
Incorporating mind maps in statistical analysis offers many advantages, significantly enhancing how data is understood, organized, and communicated. Let’s delve into these benefits.
Improved Understanding of Complex Data
Mind maps serve as an effective tool for breaking down and visualizing complex statistical data. This visual approach to data interpretation aids in understanding intricate relationships and patterns that might be overlooked in traditional, linear data presentations. For instance, when dealing with multifaceted data sets in multivariate analysis, a mind map can help visually segregate different variables and their interrelationships, making it easier to comprehend the overall structure of the data. This enhanced understanding is crucial for statisticians and data analysts, leading to more accurate interpretations and informed decision-making.
Better Organization of Statistical Methods
Another significant advantage of using mind maps in statistics is the improved organization of statistical methods and processes. Mind maps provide a clear and concise framework, whether it’s planning a research methodology or outlining the steps of a particular statistical test. This is particularly beneficial in complex procedures like sequential analysis or time series forecasting, involving multiple steps and considerations. By mapping out these processes, statisticians can ensure that all necessary steps are followed and can easily track their progress, thereby increasing the efficiency and effectiveness of their analytical work.
Enhanced Communication of Statistical Findings
One of the most crucial benefits of mind maps in statistics is the enhanced communication of statistical findings. The visual nature of mind maps makes them an excellent tool for presenting data insights in a more digestible and engaging format. This is especially important when conveying findings to audiences needing help understanding statistical concepts. For example, a mind map can be used to briefly present the results of a logistic regression analysis, highlighting key predictors and their impacts in a manner that is easily understood by non-experts. This ability to communicate complex statistical information not only aids in knowledge dissemination but also fosters a better understanding and appreciation of the value of statistical analysis among a wider audience.
Conclusion
This article underscores the transformative impact of Artificial Intelligence (AI), primarily through tools like ChatGPT, on statistics and data analysis. We’ve seen how AI enhances our ability to organize, visualize, and communicate complex statistical data using mind-mapping techniques. ChatGPT’s ability to generate human-like text simplifies the creation of mind maps, making this process accessible and intuitive. We covered its applications in statistical scenarios, the benefits of improved data understanding, organizational effectiveness, and better communication of findings. Despite some challenges, solutions are in place to maximize the use of ChatGPT in mind mapping. I urge readers, from experienced statisticians to data analysis novices, to explore ChatGPT’s potential in their work, contributing to the evolving field of AI-enhanced statistical analysis.
Recommended Articles
If you found this article insightful, our blog has more to offer! Dive deeper into the world of AI, statistics, and data analysis with our collection of articles. Discover innovative approaches, advanced techniques, and practical tips to transform your data analysis skills.
- Applied Statistics: Data Analysis
- 5 Statistics Case Studies That Will Blow Your Mind
- How to Tell Stories with Statistical Data
Frequently Asked Questions
Q1: What is Mind Mapping? Mind mapping is a visual representation technique mirroring the brain’s information processing, crucial for organizing complex statistical data.
Q2: How does AI, especially ChatGPT, enhance Mind Mapping? AI, particularly ChatGPT, enhances mind mapping by enabling dynamic, intuitive visualization and understanding of complex statistical concepts.
Q3: What sets ChatGPT apart in data analysis and statistics? ChatGPT’s unique ability to understand and generate human-like text makes it invaluable for detailed discussions and complex data analysis.
Q4: How does ChatGPT assist in creating Mind Maps for data analysis? ChatGPT streamlines mind map creation by generating structured visual representations based on statistical topics or data analysis queries.
Q5: What is the first step in creating a Mind Map with ChatGPT? Accessing and logging into ChatGPT marks the first step, connecting users to its extensive AI-driven knowledge base for mind mapping.
Q6: How does ChatGPT transform text into a Mind Map? ChatGPT converts text into Markdown format, facilitating the creation and visualization of mind maps for complex statistical data.
Q7: How are Mind Maps beneficial in statistical data analysis? Mind Maps simplify understanding complex data, organize statistical methods, and enhance the communication of findings in an engaging format.
Q8: What are some challenges in using ChatGPT for Mind Mapping? Challenges include understanding complex statistical jargon and software compatibility, which can be overcome through clear communication and supplementary tools.
Q9: How do Mind Maps bridge the communication gap in data analysis? Mind Maps provide a visual language easily understood by non-experts, enhancing discussions and decision-making in statistical analysis.
Q10: What potential does ChatGPT hold in statistical analysis and Mind Mapping? ChatGPT’s potential lies in enhancing data understanding, streamlining analysis processes, and improving communication in statistics.