
Interpreting Confidence Intervals: A Comprehensive Guide
You will learn the essential insights into accurately Interpreting Confidence Intervals.
Introduction
Confidence intervals are crucial tools in statistical analysis. Based on sample data, they offer a range within which we expect a population parameter to lie. Despite their widespread use, confidence intervals are frequently misunderstood, leading to misconceptions about their interpretation and significance.
At the heart of interpreting confidence intervals is the concept of statistical certainty but not absolute certainty. For instance, stating that we are “95% confident” does not imply a 95% chance of the parameter falling within the specified interval in repeated samples; instead, it means that 95% of such constructed intervals from repeated sampling will encompass the true population parameter.
This introduction aims to clarify these and other misconceptions, setting the stage for a deeper understanding of how confidence intervals are constructed, interpreted, and applied across various fields. Our objective is to demystify confidence intervals’ complexity, ensuring that readers grasp the essence of making informed and accurate statistical inferences.

Highlights
- A 95% confidence level means that 95% of such intervals from repeated sampling will contain the true parameter.
- Confidence intervals are calculated using sample data as a Point Estimate ± (Critical Value × Standard Error).
- Misinterpretation includes viewing the 95% confidence interval as a 95% chance of containing the parameter.
- Real-world examples, such as drug efficacy in medicine, show how confidence intervals guide significant decisions.
- Understanding interval bounds is crucial; they represent plausible range values, not the probability distribution within.
Ad Title
Ad description. Lorem ipsum dolor sit amet, consectetur adipiscing elit.
The Basics of Confidence Intervals
Confidence intervals (CIs) are fundamental statistical tools used to estimate the range within which a population parameter is likely to lie based on sample data. Understanding CIs is crucial for interpreting study results accurately and making informed decisions in various fields, from medicine to environmental science.
What Are Confidence Intervals?
A confidence interval provides a range of values calculated from the sample data likely to contain the population parameter of interest. The interval has an associated confidence level, typically expressed as a percentage (e.g., 95% or 99%), indicating the degree of certainty in the interval estimate.
Construction of Confidence Intervals
The construction of a confidence interval involves several steps:
- Sample Data Collection: Collecting a sample from the population of interest.
- Statistic Calculation: Calculating a sample statistic (e.g., mean, proportion) as a point estimate for the population parameter.
- The margin of Error Determination: Calculating the margin of error using the sample statistic’s standard error and the critical value from the z or t distribution corresponding to the desired confidence level.
- Interval Calculation: Adding and subtracting the margin of error from the sample statistic to obtain the lower and upper bounds of the confidence interval.
The formula for a confidence interval generally follows the structure:
CI = Point Estimate ± (Critical Value × Standard Error)
Statistical Theory Behind Confidence Intervals
The theoretical foundation of confidence intervals lies in probability theory and the central limit theorem. The central limit theorem states that, given a sufficiently large sample size, the sampling distribution of the sample mean will be normally distributed, regardless of the population’s distribution.
This statistical theory underpins the calculation of confidence intervals, allowing statisticians and researchers to make probabilistic inferences about population parameters based on sample data.
Real-World Applications
Confidence intervals are widely used across various disciplines to estimate parameters such as means, proportions, and differences between means. For example, in clinical research, a 95% CI for the difference in mean blood pressure between two treatment groups can provide insights into the treatment’s effectiveness and the estimate’s precision.
Confidence intervals offer a more informative alternative to point estimates by providing a range of plausible values for the population parameter, which accounts for the variability inherent in sample data. This range enables researchers to assess their findings’ statistical significance and practical relevance.
Interpreting Confidence Intervals Correctly
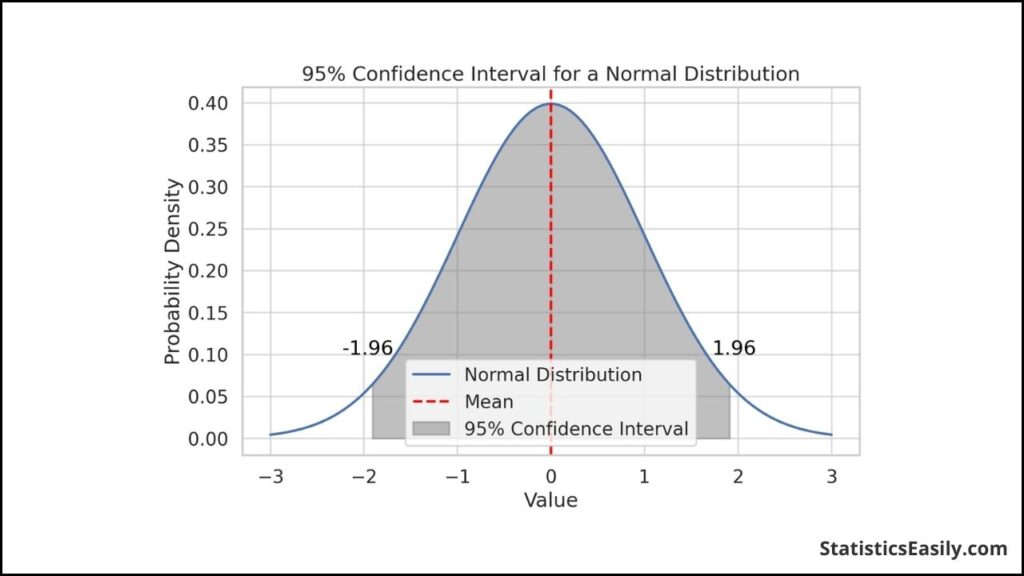
The correct interpretation of confidence intervals is pivotal for accurate statistical analysis and informed decision-making. This section focuses on the 95% confidence level, a commonly used standard in statistical practice, to elucidate the proper understanding of confidence intervals.
Understanding the 95% Confidence Level
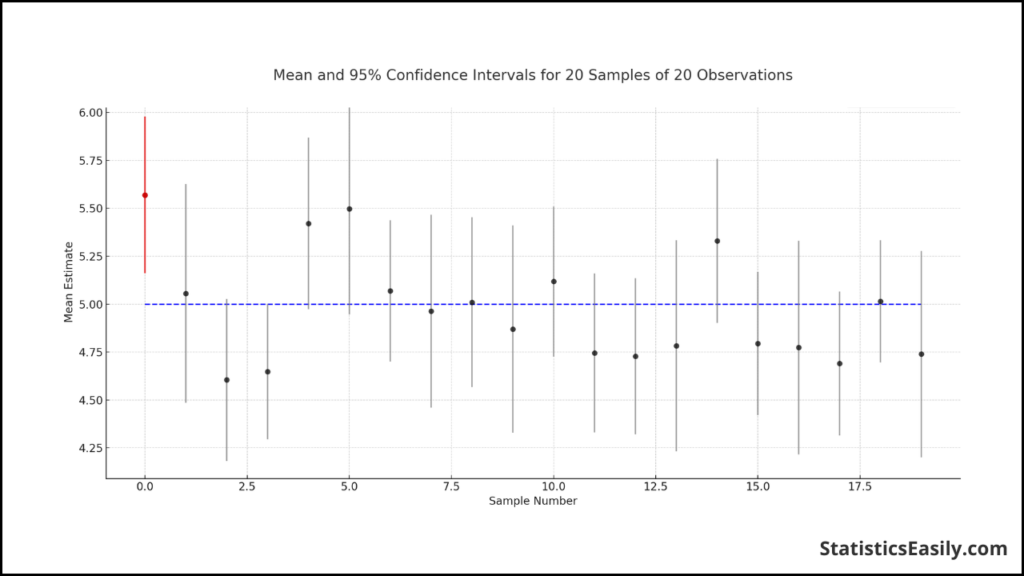
A 95% confidence interval suggests that if we were to take 100 different samples and construct a confidence interval for each, we expect about 95 of these intervals to contain the true population parameter. This interpretation underscores the probabilistic nature of confidence intervals. It highlights that they are not about the probability of the parameter lying within a specific interval from a given sample.
Significance of Upper and Lower Bounds
- Lower Bound: This starts the interval and indicates the lowest value within which the population parameter is likely to be found with the specified confidence level.
- Upper Bound: Conversely, this is the end of the interval, marking the highest value expected to encompass the population parameter.
These bounds delineate the range of plausible values for the parameter based on the sample data. It is crucial to understand that the true population parameter is fixed, and the interval “captures” this parameter with a certain level of confidence rather than the parameter “moving” within the interval.
Contextualizing Population Parameters
In the context of population parameters, the bounds of a confidence interval offer insights into the parameter’s potential variability. For example, when estimating the mean height of a population based on a sample, a 95% confidence interval of [160 cm, 170 cm] indicates that, based on our sample data, we are 95% confident the true mean height of the entire population falls between these two values.
Critical Takeaways for Correct Interpretation
- Confidence Level: This represents the frequency with which intervals constructed in the same way from different samples would encompass the true population parameter.
- Interval Bounds: These are not about the likelihood of the parameter being at the extremes but rather about the range covering the parameter.
- Fixed Parameter: The population parameter is a fixed quantity, and the confidence interval provides a range based on the sample about where this fixed value lies.
Understanding these aspects is essential for interpreting confidence intervals accurately, avoiding common misconceptions, and applying statistical findings effectively in real-world scenarios.
Common Misinterpretations and How to Avoid Them
Misunderstandings surrounding confidence intervals can lead to incorrect conclusions and misuse of statistical data. Recognizing and avoiding these common pitfalls is essential for accurate data interpretation.
Misinterpretation 1: Confidence Level as Probability of Containment
A frequent misconception is viewing a 95% confidence interval as implying a 95% probability that the interval contains the true population parameter. This interpretation is incorrect because the interval either contains the parameter or does not; the 95% confidence level relates to the long-run proportion of such intervals containing the parameter if we repeated the study many times.
How to Avoid: Understand that the confidence level refers to the method’s reliability over many samples, not the probability of a single interval containing the parameter.
Misinterpretation 2: The Parameter Lies Equally Across the Interval
Another common error is assuming the population parameter is equally likely to be anywhere within the interval. The confidence interval provides a range of plausible values. Still, it does not suggest that the parameter is more likely to be near the center of the interval than at the ends.
How to Avoid: Recognize that the interval indicates a range of plausible values for the parameter without specifying the likelihood distribution within this range.
Misinterpretation 3: Narrower Intervals Indicate More Precision
Narrower intervals are often misconstrued as more precise or accurate. However, a narrow interval can result from a small sample size or high confidence level, which might not necessarily mean greater precision or accuracy regarding the true population parameter.
How to Avoid: Evaluate the context, including sample size and confidence level, when interpreting the width of a confidence interval.
Misinterpretation 4: Overlapping Intervals and Statistical Significance
The overlap of confidence intervals between two groups is sometimes incorrectly taken to mean no significant difference between the groups. While overlap can suggest a closer examination is needed, it does not alone determine statistical significance.
How to Avoid: Use appropriate hypothesis testing and confidence intervals to assess statistical significance between groups.
Misinterpretation 5: Confidence Intervals for Predictive Purposes
Using confidence intervals to predict future observations is a misuse of the concept. Confidence intervals estimate a population parameter, not the range of individual future observations.
How to Avoid: Distinguish between estimating population parameters and predicting individual outcomes; use prediction intervals for the latter.
Practical Examples of Confidence Interval Interpretation
Practical examples are an excellent tool for demystifying the abstract concept of confidence intervals. This section presents detailed scenarios from medicine, environmental science, and economics, illustrating each example’s calculation, interpretation, and implications of confidence intervals.
Example 1: Medicine – Effectiveness of a New Drug
A pharmaceutical company conducted a clinical trial to compare the effectiveness of a new drug to a standard treatment. The primary endpoint was the change in systolic blood pressure after 12 weeks of treatment.
- Data: The mean change in systolic blood pressure for the new drug was -15 mmHg, with a standard deviation of 10 mmHg, based on a sample of 100 patients.
- Calculation: A 95% confidence interval for the mean change in systolic blood pressure was calculated as -15 mmHg ± 1.96 × (10 mmHg / √100), resulting in [-17, -13] mmHg.
- Interpretation: We are 95% confident that the true mean change in systolic blood pressure for the population treated with the new drug lies between -17 and -13 mmHg.
- Implications: The interval does not include 0, suggesting that the drug has a statistically significant effect on lowering blood pressure.
Example 2: Environmental Science – Air Quality Improvement
An environmental agency monitored the improvement in air quality in a city following implementing a new public transportation policy.
- Data: Based on monthly samples over a year, the average reduction in particulate matter (PM2.5) was 5 µg/m³, with a standard deviation of 2 µg/m³.
- Calculation: A 95% confidence interval for the average reduction in PM2.5 was calculated as 5 µg/m³ ± 1.96 × (2 µg/m³ / √12), resulting in [4.07, 5.93] µg/m³.
- Interpretation: We are 95% confident that the true average reduction in PM2.5 due to the policy lies between 4.07 and 5.93 µg/m³.
- Implications: The interval indicates a significant productivity improvement, justifying the training program’s investment.
Example 3: Economics – Impact of Training on Employee Productivity
A corporation assessed the impact of a new training program on employee productivity measured by the number of units produced per hour.
- Data: After training, the mean increase in productivity was 3 units/hour, with a standard deviation of 1.5 units/hour, based on a sample of 50 employees.
- Calculation: A 95% confidence interval for the mean increase in productivity was calculated as 3 units/hour ± 1.96 × (1.5 units/hour / √50), resulting in [2.32, 3.68] units/hour.
- Interpretation: We are 95% confident that the true mean increase in productivity among all employees after the training lies between 2.32 and 3.68 units/hour.
- Implications: The interval indicates a significant productivity improvement, justifying the training program’s investment.
Advanced Concepts in Confidence Intervals
This section illuminates non-parametric confidence intervals, Bayesian confidence intervals, and the nuanced implications of sample size and variance on confidence intervals. These advanced concepts broaden our understanding and enhance the interpretative power and reliability of CIs in complex analytical scenarios.
Non-Parametric Confidence Intervals
Traditional CIs often rely on the assumption of data following a normal distribution, especially for small sample sizes, where the central limit theorem aids this approximation. However, real-world data can deviate significantly from this assumption, necessitating non-parametric methods. Non-parametric CIs, such as those derived from the bootstrap method, do not assume a specific data distribution, making them versatile and robust for a wide range of data types. This flexibility allows for more accurate interval estimates in non-normal or unknown distributions, albeit often at the cost of increased computational complexity.
Bayesian Confidence Intervals
Bayesian confidence intervals, or credible intervals, incorporate prior knowledge or beliefs into the interval estimation process. Unlike the frequentist approach, which interprets CIs purely from the sampled data, Bayesian intervals combine this data with prior distributions to form a posterior distribution of the parameter of interest. This approach provides a more comprehensive framework for uncertainty estimation, particularly beneficial in fields like medicine or policy analysis, where prior studies or domain knowledge play a crucial role in interpreting current findings.
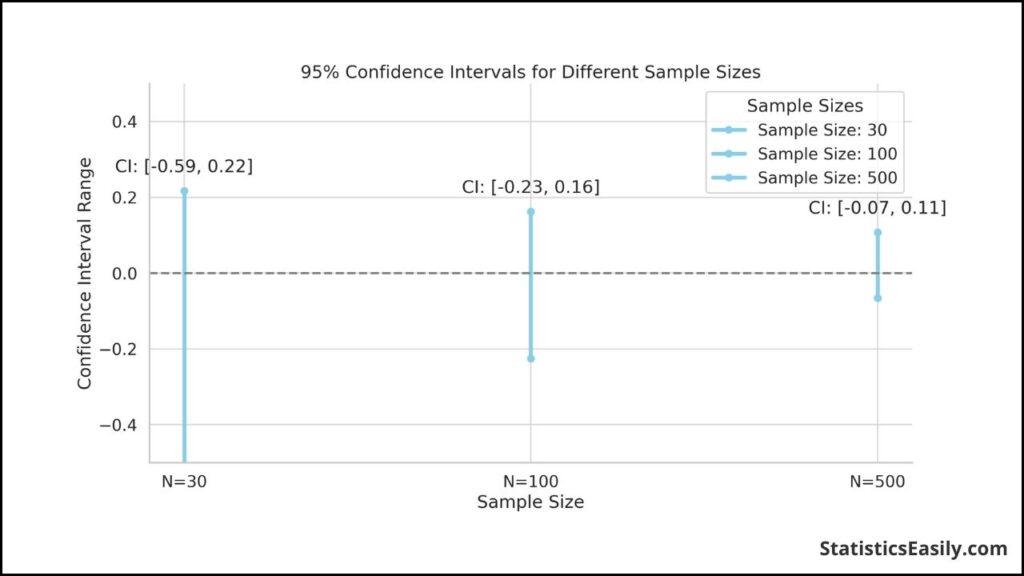
Implications of Sample Size and Variance
The reliability and width of confidence intervals are directly influenced by the sample size and data variance. Larger samples tend to produce narrower intervals, reflecting reduced uncertainty about the parameter estimate. Conversely, the high variance within the data leads to wider intervals, indicating greater uncertainty. Understanding these relationships is crucial for designing studies and interpreting CIs, as it highlights the trade-offs between sample size, data variability, and the precision of interval estimates.
Ad Title
Ad description. Lorem ipsum dolor sit amet, consectetur adipiscing elit.
Conclusion
Throughout this comprehensive guide on Interpreting Confidence Intervals, we have navigated the foundational concepts, practical applications, common misconceptions, and real-world examples that underscore the pivotal role of confidence intervals in statistical analysis and informed decision-making.
Key Takeaways:
- Confidence intervals provide a range of plausible values for a population parameter derived from sample data, with an associated confidence level indicating the degree of certainty.
- Correct interpretation hinges on understanding that a 95% confidence level does not imply a 95% probability of the parameter falling within the interval. Instead, if the process is repeated across many samples, 95% of such intervals will contain the true parameter.
- Misinterpretations of confidence intervals can significantly skew one’s understanding and application of statistical findings. It’s crucial to avoid common pitfalls by appreciating the nuances of interval bounds and the fixed nature of population parameters.
- Examples from medicine, environmental science, and economics illustrated confidence intervals’ calculation, interpretation, and implications, showcasing their versatility and importance across diverse fields.
The correct interpretation of confidence intervals is not just an academic exercise but a fundamental aspect of conducting robust scientific research and making sound decisions based on data. As we delve into statistical analyses, let us remain vigilant in understanding and applying confidence intervals, ensuring our conclusions are both scientifically accurate and meaningful.
To foster a deeper understanding and appreciation for statistical best practices, we encourage readers to explore further resources and continue engaging with statistical concepts to enhance their analytical skills.
Recommended Articles
Explore more insights and deepen your understanding with our collection of articles on related statistical topics. Dive in now!
- How to Interpret Confidence Intervals?
- Accuracy, Precision, Recall, or F1
- Confidence Interval Calculator
Frequently Asked Questions (FAQs)
Q1: What Exactly Are Confidence Intervals? Confidence intervals provide a range where we expect the true population parameter to lie, based on sample data, with a certain degree of confidence.
Q2: What Does a 95% Confidence Interval Signify? A 95% confidence interval means that if we repeat the sampling process many times, about 95% of the intervals created would contain the true population parameter.
Q3: Why Are Confidence Intervals Critical in Statistics? They allow us to estimate the uncertainty of a parameter estimate, offering a range of plausible values instead of just a single-point estimate, enhancing the reliability of statistical conclusions.
Q4: How Do Confidence Level and Interval Differ? The confidence level indicates how often the confidence interval would contain the true parameter if the experiment were repeated, while the interval itself is the range of values that likely includes the true parameter.
Q5: Can Confidence Intervals Be Used for Predictions? Confidence intervals are designed to estimate population parameters, not to predict individual future observations.
Q6: How Do Sample Size and Variance Influence Confidence Intervals? Larger sample sizes and smaller variances result in narrower confidence intervals, indicating more precise population parameter estimates.
Q7: What Misinterpretations Should Be Avoided? Common errors include mistaking the confidence level for the probability that the interval contains the parameter and assuming the parameter is equally likely to be anywhere within the interval.
Q8: In What Real-World Applications Are Confidence Intervals Used? They are utilized in fields like medicine to assess drug efficacy, environmental science to study air quality improvements, and economics to assess the impact of training programs on productivity.
Q9: What Do the Upper and Lower Bounds Represent? The bounds of a confidence interval represent the range within which the true population parameter is likely to be found with the specified confidence level.
Q10: How Are Non-Parametric and Bayesian Confidence Intervals Unique? Non-parametric intervals do not rely on data distribution assumptions. In contrast, Bayesian intervals incorporate prior knowledge or beliefs in the calculation process.