10 Revolutionary Techniques to Master Statistics and Data Analysis Effortlessly!
You will learn how to transform complex data into actionable insights through 10 innovative techniques, enhancing your statistics and data analysis skills to navigate the modern data-driven world with ease and confidence.
Introduction
Welcome to the exhilarating world of data! In our contemporary, data-centric era, mastering the arts of statistics and data analysis isn’t just a skill — it’s akin to having a superpower. The challenge lies in converting intricate data into insightful, comprehensible information without feeling overwhelmed. Fear not! We’re about to reveal 10 innovative techniques that will transform you into a data analysis maestro, all achieved with remarkable ease.
Highlights
- Hands-on data manipulation enhances understanding and memory, making abstract concepts tangible and more accessible.
- Advanced tools like Tableau and R’s ggplot2 turn complex data into clear, visual narratives, revealing hidden trends and patterns.
- The chunking technique in data analysis breaks down significant topics into smaller segments, simplifying the learning process.
- Sleep significantly boosts memory consolidation, enhancing learning and comprehension in data analysis.
- Variations in practice sessions improve adaptation and understanding of data analysis, leading to faster skill development.
1. Embrace Hands-On Experimentation
Plunge headfirst into the depths of data with hands-on projects. Much like sculpting a masterpiece, engaging with data sets — sorting, analyzing, and manipulating — significantly boosts your understanding and memory retention. This tactile learning process helps you internalize the nuances of data, making complex concepts more approachable and less abstract.

2. Visualize for Victory
Data visualization is far more than mere aesthetics; it’s the cornerstone of data comprehension. Tools like Tableau or R’s ggplot2 aren’t just for creating pretty graphs — they’re your allies in translating raw, daunting numbers into compelling, easily digestible visual narratives. By learning to visualize data effectively, you transform abstract figures into meaningful, story-driven visuals that unveil trends, patterns, and insights hidden within the numbers.

3. Break It Down: Chunk Your Learning
Approach statistics and data analysis in manageable, bite-sized portions. The ‘chunking’ technique — celebrated for its effectiveness in cognitive psychology — helps you to methodically organize and absorb substantial amounts of data without feeling swamped. By dividing complex topics into smaller, more digestible segments, you can focus on and master one aspect before moving on to the next, thus streamlining the learning process.

4. Sleep On It: The Secret Ingredient
Remember the power of a good night’s sleep, especially in learning. Research has consistently shown that sleep plays a crucial role in memory consolidation — the process where our brains turn new learnings into long-term memories. Studying before bedtime and revisiting the material after waking up can significantly improve memory retention and comprehension.

5. Practice with Purpose
To truly master data analysis, avoid the trap of monotonous repetition. Instead, introduce subtle variations in your practice sessions. This method challenges your brain, forcing it to adapt and improve. Each variation in your practice brings a new perspective and understanding, accelerating your learning and skill development.

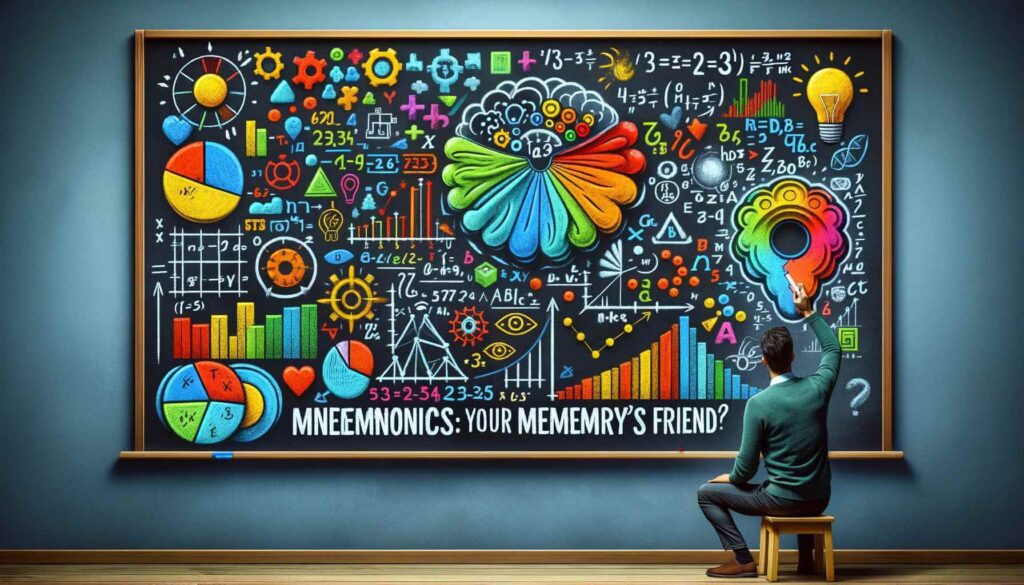
6. Mnemonics: Your Memory’s Best Friend
Mnemonics serve as a lifeline in the vast ocean of data and statistics. These memory aids — acronyms, catchy phrases, or even simple rhymes — are invaluable for recalling complex statistical formulas or principles. This timeless technique simplifies the daunting task of memorizing large volumes of information, making it more manageable and less intimidating.
7. Mindful Breaks: Refresh and Recharge
Data overload can lead to cognitive burnout. To prevent this, incorporate regular, mindful breaks into your study regimen. These pauses are essential for mental rejuvenation, allowing your brain to process and solidify the information you’ve learned. A few minutes away from your data can significantly increase your focus and efficiency upon return.

8. Hydration: The Cognitive Catalyst
While it’s commonly known that hydration is vital for physical health, its impact on cognitive function is often overlooked. A well-hydrated brain is more efficient at processing and retaining information. Regular water intake during study sessions can enhance your focus, memory, and overall brain performance.

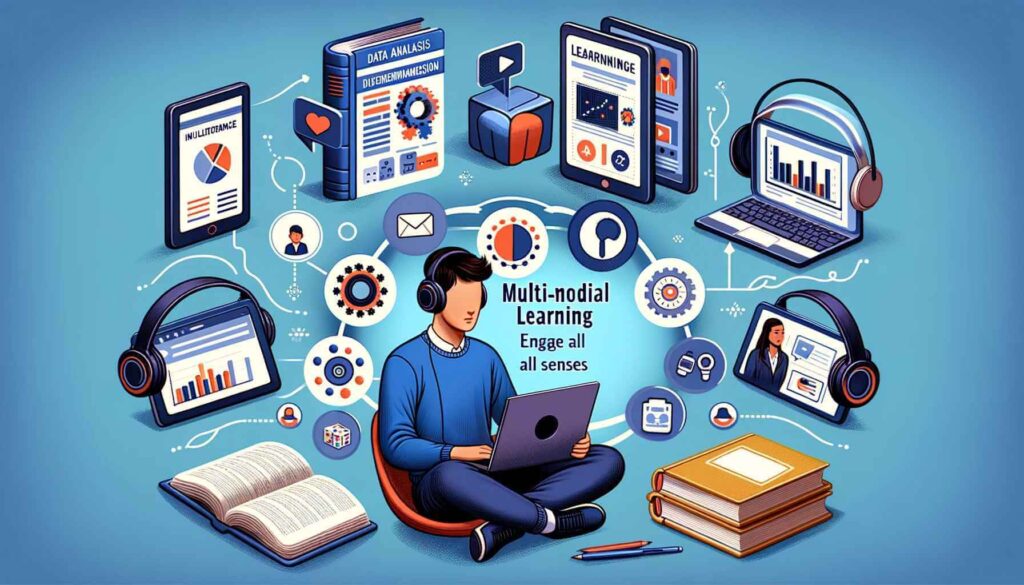
9. Multi-Modal Learning: Engage All Senses
Diversify your learning methods by engaging with the material through various mediums. Watch educational videos, listen to podcasts, participate in interactive tutorials, and read textbooks. This multi-modal approach stimulates different brain areas, creating a more dynamic, comprehensive, and enduring learning experience.
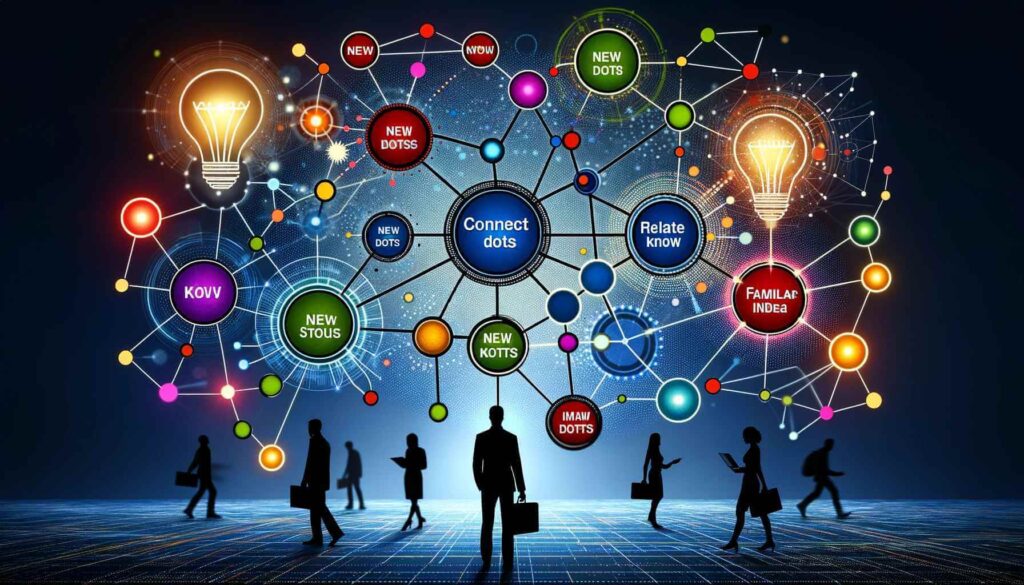
10. Connect Dots: Relate New to Known
One of the most effective ways to grasp new data concepts is by linking them to ideas you’re already familiar with. This technique, known as relational learning, helps anchor further information to existing knowledge, making complex data more understandable and applicable in various contexts.
Conclusion
Becoming a data analysis prodigy doesn’t require mystical powers. It’s about employing intelligent strategies and practical techniques. By integrating these 10 techniques into your study routine, you’ll unlock unprecedented potential in data. Embrace these methods and embark on a discovery, analysis, and insight journey. Happy analyzing!
Recommended Articles
Are you interested in diving deeper into the world of data and statistics? Explore our blog for more insightful articles and take your data analysis skills to the next level!
- The Power of Mind Mapping with ChatGPT
- 5 Statistics Case Studies That Will Blow Your Mind
- How to Tell Stories with Statistical Data
Frequently Asked Questions (FAQ)
Q1: What is Data Visualization? Data visualization is the graphical representation of information and data, using visual elements like charts, graphs, and maps to provide an accessible way to see and understand trends, outliers, and patterns in data.
Q2: How Does Sleep Affect Learning? Sleep plays a critical role in consolidating memories and learning. It helps process new information and transfer it to long-term memory, enhancing learning and comprehension.
Q3: What is the Chunking Technique in Learning? Chunking is a method of breaking down large pieces of information into smaller, manageable units (chunks), making it easier to process and remember the information.
Q4: Why are Mnemonics Effective in Learning? Mnemonics are memory aids that help in recalling information. They work by associating easy-to-remember clues with complex information, thus enhancing the ability to remember data and formulas.
Q5: What is the Importance of Hydration in Cognitive Function? Hydration is crucial for cognitive function. Adequate water intake helps maintain brain function, focusing, memory, and processing speed.
Q6: How Does Hands-On Experimentation Benefit Data Analysis Learning? Hands-on experimentation in data analysis involves actively engaging with data, which enhances understanding and memory retention by making abstract concepts more tangible.
Q7: What is the Role of Variability in Practice Sessions? Introducing variability in practice sessions challenges the brain to adapt and improve, offering new perspectives and understanding and accelerating learning and skill development.
Q8: What are Mindful Breaks and Their Benefits? Mindful breaks are short pauses during intensive learning or work to prevent cognitive burnout. They help in mental rejuvenation and maintaining focus and efficiency.
Q9: What is Multi-Modal Learning? Multi-modal learning involves using various methods and senses for learning, such as visual (videos), auditory (podcasts), and kinesthetic (interactive tutorials), to enhance understanding and retention.
Q10: How Does Relational Learning Aid in Data Analysis? Relational learning involves connecting new concepts to already known ideas, which helps better understand and apply complex data in various contexts.