
Random Sampling on Excel: An In-depth Analysis
To perform random sampling on Excel, first, organize your data in one column. Next, generate random numbers in an adjacent column using the “=RAND()” function. Then, sort the data by these random numbers. Finally, select your sample from the top n rows.
Introduction
Random sampling represents a critical concept in statistics and data analysis. It refers to the technique where each population member has an equal probability of being selected. This method forms the backbone of statistical inference, where conclusions about a population are made based on a sample. Random sampling helps mitigate bias, ensuring that the sample is representative of the entire population, thereby allowing for more reliable and generalizable results.
In the era of big data, where organizations have vast data, random sampling proves even more vital. It enables the processing of a manageable amount of data while still capturing the essence of the entire dataset. Therefore, understanding and applying random sampling effectively is fundamental for anyone venturing into data analysis.
Highlights
- Random sampling ensures each member of a population has an equal probability of being selected, reducing bias.
- Excel’s built-in functions, RAND() and RANDBETWEEN() enable powerful random sampling techniques.
- Inappropriate sample size could lead to non-representative samples or inefficiencies.
- Market researchers, auditors, healthcare researchers, and manufacturing industries find practical applications of random sampling in Excel.
- Mastering random sampling in Excel enables efficient, reliable data analysis and unbiased, actionable statistical insights.
Ad Title
Ad description. Lorem ipsum dolor sit amet, consectetur adipiscing elit.
Understanding Excel for Data Analysis
Data analysis experts commonly use Excel as their go-to software. It offers a comprehensive suite of tools that aid in manipulating, analyzing, and visualizing data. Excel is an indispensable tool for analysts, from simple tasks such as sorting and filtering data to more complex ones like regression analysis and forecasting.
One key feature of Excel is its ability to perform random sampling. Users can effortlessly generate random numbers thanks to built-in functions such as RAND() and RANDBETWEEN(). When used effectively, these functions enable powerful random sampling techniques, which are fundamental for any statistical analysis.
Step-by-step Guide to Perform Random Sampling on Excel
Now, let’s dive into the process of performing random sampling on Excel:
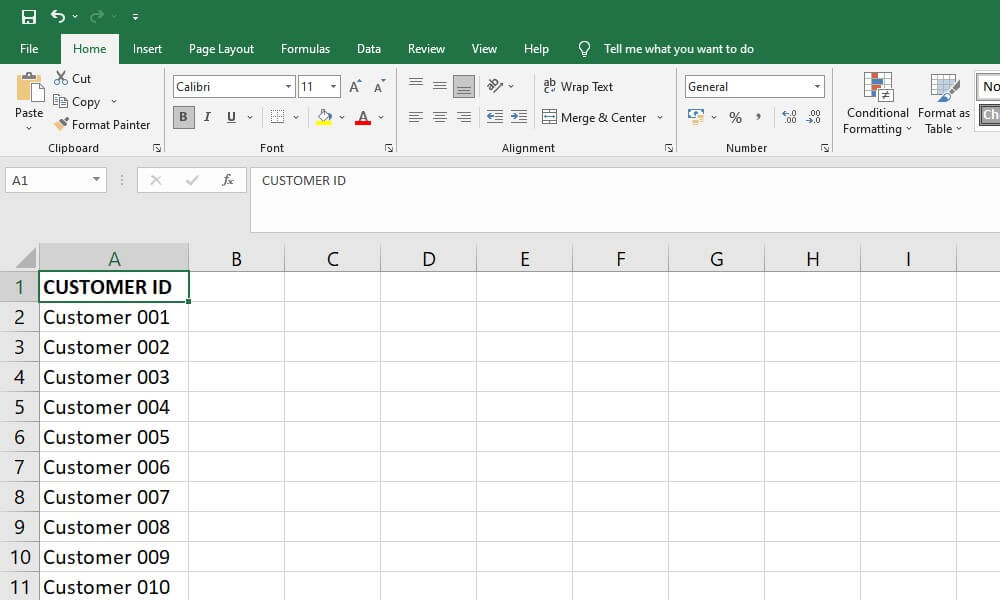
Prepare Your Data: Organize your data in a single column. For example, let’s say you have a list of 1000 customers and want to select a random sample of 100; ensure all customer names or IDs are in one column.
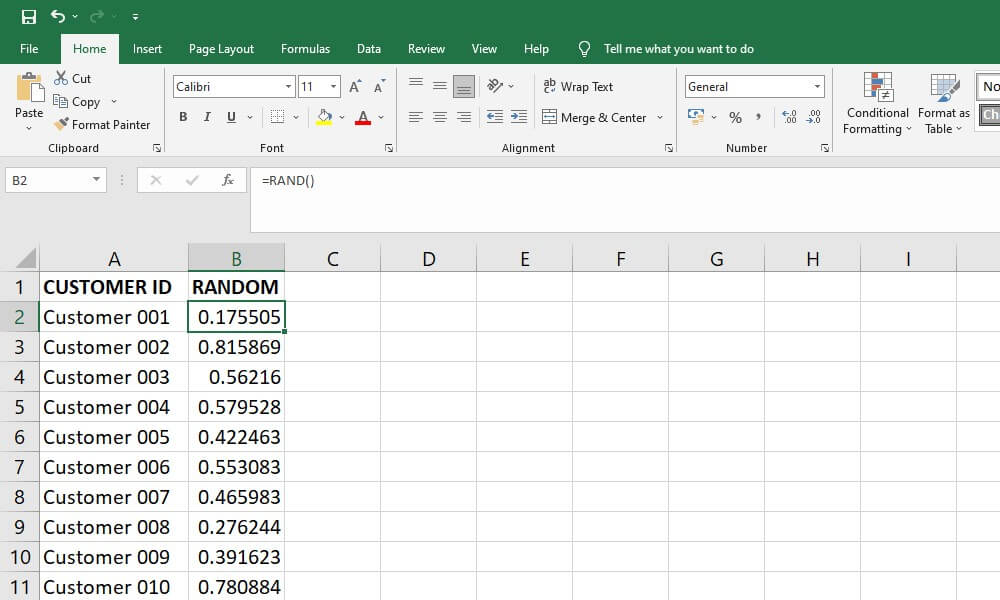
Generate Random Numbers: In the adjacent column, use the RAND() function to obtain a random number between 0 and 1 for each row.
Sort the Data: Select only the column with the random numbers to sort the data. Make sure the “Expand the selection” option is chosen when prompted. This option will also sort your original data column based on the order of the random numbers, effectively creating a random arrangement of your data.
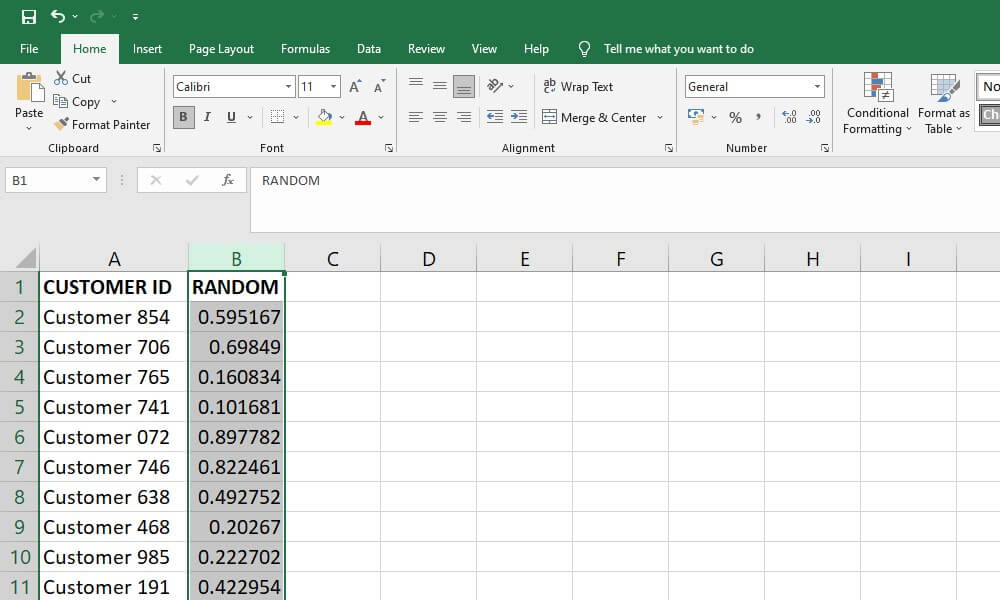
Select Your Sample: Select the top n rows of your sorted data, where n is your desired sample size. For our example, you would choose the top 100 rows.
And voila, you’ve just performed random sampling on Excel!
Practical Applications of Random Sampling in Excel
The power of random sampling in Excel can be harnessed in numerous ways. For instance, market researchers can use it to select a representative sample from their customer base for a survey. Auditors can use it to select a random subset of financial transactions for detailed scrutiny, which is often more practical than examining every transaction.
Similarly, healthcare researchers could randomly select patients for a clinical trial to ensure an unbiased sample. Manufacturing industries can also apply it in quality control, randomly selecting items from a production lot for inspection. These practical applications highlight the wide-ranging usefulness of understanding random sampling in Excel.
Ad Title
Ad description. Lorem ipsum dolor sit amet, consectetur adipiscing elit.
Common Mistakes to Avoid While Doing Random Sampling on Excel
While efficient and powerful, executing random sampling on Excel can present certain common pitfalls that might skew your results. One such error is inadvertently using the random number column for further analysis.
Mistaking Random Numbers for Data: This mistake arises when the column of random numbers generated for sorting is mistakenly used as data for subsequent analysis. This could drastically affect the outcome and validity of your analysis. Always remember that random numbers are just a tool for sorting and should not be included as part of your dataset for analysis.
Handling Duplicates: Another common pitfall involves duplicate entries in your dataset. Duplicates can skew your sample, making it less representative of your population. Therefore, always scrutinize your data for duplicate entries and decide on a strategy to deal with them based on the nature of your analysis.
Choosing the Right Sample Size: Selecting an appropriate sample size is critical. A sample size that’s too small may not be representative, while a sample size that’s too large could be inefficient. Be sure to employ statistical methods or seek expert advice to determine an appropriate sample size for your analysis.
By being aware of these mistakes, you can ensure that using random sampling in Excel is accurate and effective.
Recommended Articles
Interested in exploring more about Excel and data analysis techniques? Check out other relevant articles on our blog and enhance your statistical expertise!
- How to Create Regression Lines in Excel
- Unraveling Sampling Bias: A Comprehensive Guide
- How to Calculate the Median in Excel – Simple Steps
- Simple Random Sample – an overview (External Link)
- Selection Bias in Data Analysis: Understanding the Intricacies
- Understanding Sampling Error: A Foundation in Statistical Analysis
- Understanding Random Sampling: Essential Techniques in Data Analysis
Frequently Asked Questions (FAQs)
Random sampling is a statistical technique where each population member has an equal probability of being selected.
Random sampling helps manage large datasets effectively, making data processing manageable while maintaining representativeness.
Excel uses functions like RAND() and RANDBETWEEN() for random sampling.
Generate random numbers using RAND(), sort the data, and then select the top n rows where n is your desired sample size.
The function RAND() generates a random number between 0 and 1 each time a worksheet is calculated.
If you accidentally use the random number column for data analysis, it could significantly skew your results. The random numbers are for sorting purposes only and should not be included in the dataset for analysis.
Duplicates can distort your sample and render it unrepresentative of the population.
The ideal sample size depends on the study; it shouldn’t be too small to be unrepresentative or too large to be inefficient.
Applications include selecting a representative sample for surveys, auditing financial transactions, clinical trials, and quality control in manufacturing.
Learning random sampling in Excel enables efficient and reliable data analysis. It lays the foundation for unbiased and actionable statistical insights.