
Rows and Columns: Understanding the Structural Essence of Data
You will learn the critical distinctions and uses of rows and columns in data structuring for practical analysis.
Introduction
In data analysis, the organization of information is paramount. It is the scaffold upon which our understanding of complex datasets is built. Rows and columns form the backbone of this structure, allowing for the systematic arrangement essential in distilling raw data into actionable insights. This organization facilitates a more transparent comprehension and a more effective data interrogation, serving various fields, from statistics to machine learning.
Tabulation is the process by which this order is imposed. The systematic placement of data into rows vs columns creates tables – the most fundamental format for data analysts and scientists alike. This structured form of data is not just for aesthetic symmetry; it’s the crux of data usability, enabling complex calculations and comprehensive analyses.
This article intends to unravel the often misunderstood differences between rows and columns. While both are integral to data organization, their roles and applications differ significantly. By the end of this discussion, the reader will have a firm grasp of the distinction between rows vs columns. This understanding is crucial for anyone looking to master the art of data analysis and manipulation.
Highlights
- Rows run horizontally, typically labeled with numbers, representing individual records in databases.
- Columns stand vertically, marked by letters, encapsulating distinct data attributes for analysis.
- In spreadsheets, the intersection of rows and columns forms cells, the primary data storage unit.
- Understanding rows vs columns is crucial for accurate data organization, manipulation, and retrieval.
- Rows and columns facilitate data comparison, supporting informed decision-making in data science.
Ad Title
Ad description. Lorem ipsum dolor sit amet, consectetur adipiscing elit.
Fundamental Concepts
Data, in its raw form, can be overwhelming and unintelligible. However, when organized into rows vs columns, it becomes a powerful tool for insight and action. To harness this power truly, one must understand what these terms mean and how they differ.
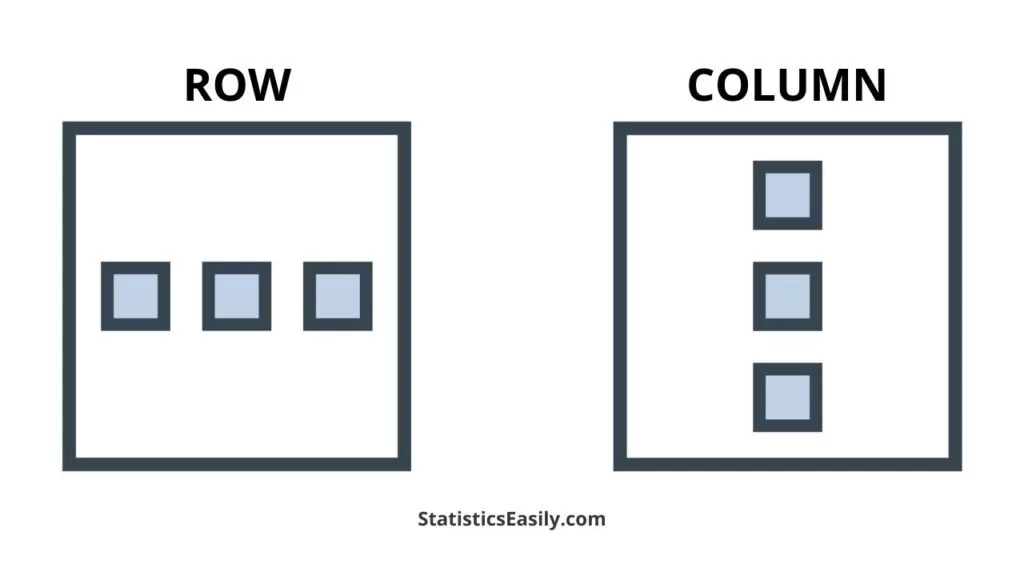
What is a Row? A row is a horizontal arrangement of data points. In a database, each row, often referred to as a record, represents a single, unique entry or item. For example, in a database containing book information, each row would convey a different book, with its details spread horizontally across the database.
What is a Column? A column is a vertical arrangement of data that stands as a single attribute across multiple rows. It holds the same type of data for each record. Taking the books database example, one column may represent the ‘Author’ attribute, containing different authors’ names in each row entry.
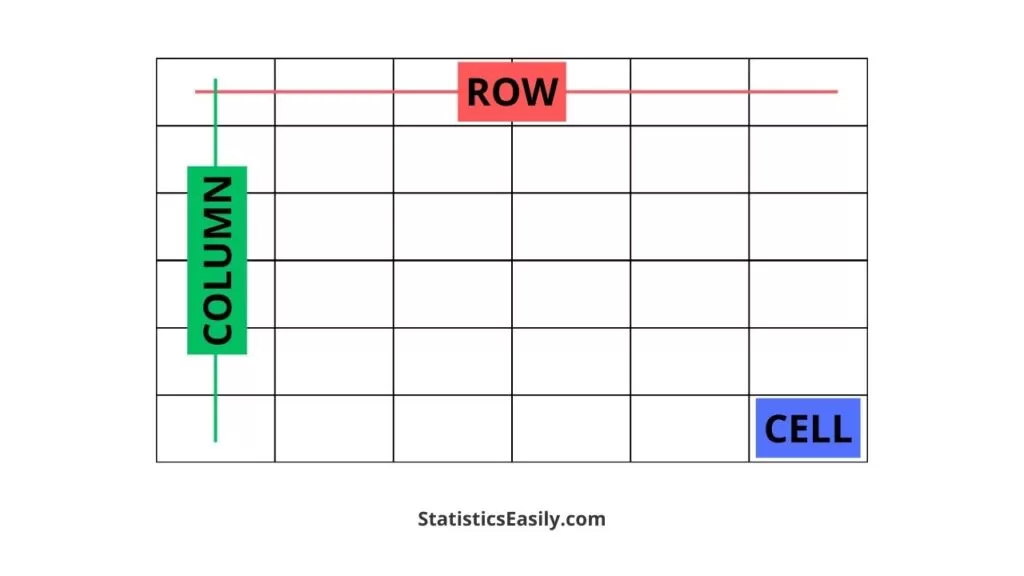
The visual representation of data in rows and columns makes it understandable and allows for efficient analysis and processing. In a spreadsheet, for instance, where these concepts are most commonly applied, rows are typically labeled with numbers (1, 2, 3) and columns with letters (A, B, C). The intersection point of a row and a column is called a cell, and it is the single point where data is stored within the grid.
Comparative Analysis: Rows and Columns
| Aspect | Rows | Columns |
|---|---|---|
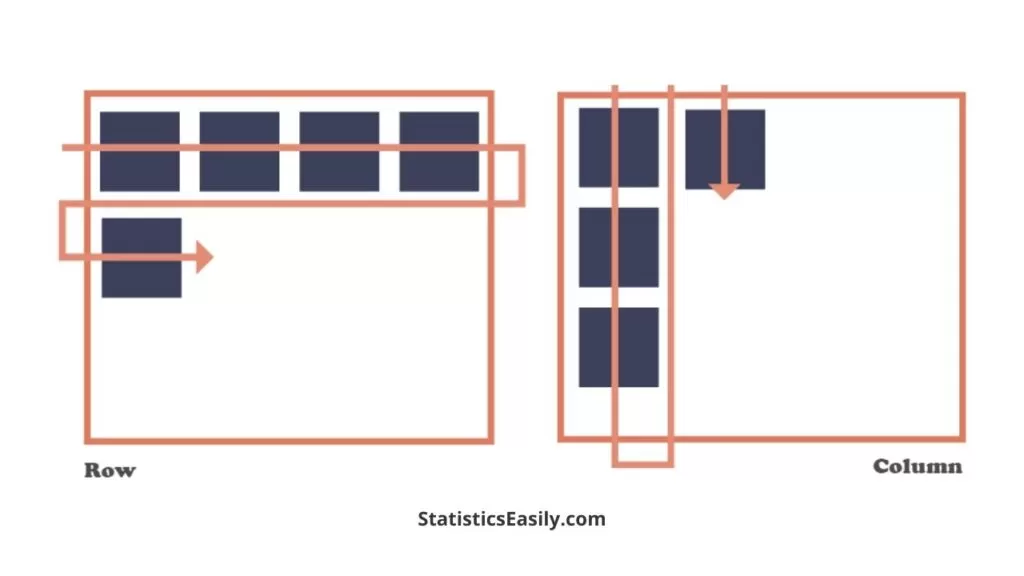
| Orientation | Horizontal, going from left to right | Vertical, extending from top to bottom |
| Labeling | Typically with numbers (1, 2, 3, …) | Generally with letters (A, B, C, …) |
| Function | Represents individual records or entries | Represents individual attributes or fields |
| In Spreadsheets | Identified by row numbers on the left | Identified by column letters at the top |
| In Databases | Known as records, a collection of fields | Known as fields, holding data for a single attribute |
| In Matrices | Horizontal arrays, one dimension of the matrix | Vertical arrays, another dimension of the matrix |
Rows
1. Serve as a linear sequence of data, where each row contains related information that collectively forms a record.
2. In the context of databases, rows correspond to the concept of tuples, each containing data for multiple attributes of a single entity.
3. The horizontal layout of rows aligns with the natural way of reading, making it intuitive for data entry and review.
Columns
1. Act as the categorizing principle of tabulation, where each column holds data for a single attribute across various entries.
2. Columns are pivotal for sorting and filtering operations, allowing for data organization based on attribute values.
3. They play a critical role in defining the schema of a dataset, specifying the type and nature of data held within.
Ad Title
Ad description. Lorem ipsum dolor sit amet, consectetur adipiscing elit.
Conclusion
As we reach the culmination of our exploration into the pivotal roles of rows and columns in data structuring, we can reflect on the key insights that solidify their essence in data analysis. Rows, running horizontally and typically labeled with numbers, represent the individual records comprising the databases’ depth. Conversely, columns stand vertically, marked with letters, and encapsulate the distinct data attributes that provide the framework for thorough analysis.
The intersection of rows and columns forms the cells of spreadsheets, the primary units of data storage, illustrating the critical nature of understanding the dynamic between rows vs columns. This comprehension is not a mere academic exercise but a prerequisite for precise data organization, manipulation, and retrieval. By facilitating data comparison, rows and columns support informed decision-making, a testament to their significance in data science.
In sum, the structured order provided by rows and columns is not just a facet of data organization but the bedrock upon which data analysis and interpretation stand. For aspiring data analysts, statisticians, or anyone seeking to wield data power, mastering the distinction and application of rows and columns is not just beneficial — it is imperative. This article has aimed to provide that foundational knowledge, empowering you to harness the full potential of data for insightful, actionable outcomes.
Recommended Articles
Explore more insights and deepen your understanding of data structures by reading our related articles.
- 10 Revolutionary Techniques to Master Data Analysis Effortlessly!
- 5 Statistics Case Studies That Will Blow Your Mind
- How Statistics Can Change Your Life: A Guide for Beginners
Frequently Asked Questions (FAQs)
Q1: How do rows and columns aid in data organization? Rows and columns are foundational in structuring data, enabling systematic storage and easy access for analysis.
Q2: What’s the significance of understanding rows vs columns? Grasping the concept of rows and columns enhances your ability to navigate and manipulate data across various platforms.
Q3: Can rows and columns impact the outcome of data analysis? Yes, correctly identifying and using rows and columns ensures data integrity and accuracy in analysis results.
Q4: Are there specific rules for labeling rows and columns? Rows are generally tagged with numbers, while columns are identified with letters for standardization and ease of reference.
Q5: How do rows and columns interact in a spreadsheet? They intersect to form cells, the fundamental units where data is entered and stored in a spreadsheet.
Q6: What is a cell in the context of rows and columns? A cell is a specific location at the intersection of a row and a column used to hold a single data point.
Q7: In database terminology, what are rows and columns known as? Rows are often called records, while columns are called fields, each holding related data.
Q8: Why is the orientation of rows and columns important? Orientation determines how data is read and interpreted, affecting sorting, filtering, and retrieving operations.
Q9: How do rows and columns facilitate data comparisons? They allow for side-by-side data placement, making comparing and analyzing different data sets easier.
Q10: What role do rows and columns play in statistical analysis? They organize data into a format that can be easily used for statistical methods and visual data representations.