How To Lie With Statistics?


Is it possible to lie using statistics? Indeed, it is, and it may be more prevalent than you anticipate.
So, how does one manipulate statistics, and more importantly, how can one avoid falling prey to these distortions?
This article explores various techniques often used to misrepresent data and provides an invaluable reference for readers seeking to avoid deception.
Journalists, marketers, and even scientists can sometimes employ statistics, diagrams, tables, and graphs in ways that mislead the audience. Thus, it’s essential to remain vigilant and not fall for these deceits!
It is generally agreed that statistical data when used to present information, lends an air of credibility to the conveyed message. This is an expected reaction, demonstrating people’s respect and regard for the field of Statistics.
However, opportunists can exploit this trust, presenting false information masquerading as truth by relying on concocted or manipulated statistical data. When scrutinized, these deceits are typically frail or entirely unfounded.
This article provides valuable information and resources for data analysts and those who no longer wish to be hoodwinked by statistical deception.
Statistical manipulations permeate numerous societal sectors, with profound impacts on our lives. For instance, a well-planned combination of voter intent data, journalism, and marketing could decisively influence election outcomes.
To avoid being misled, it is crucial to understand the techniques behind these manipulations.
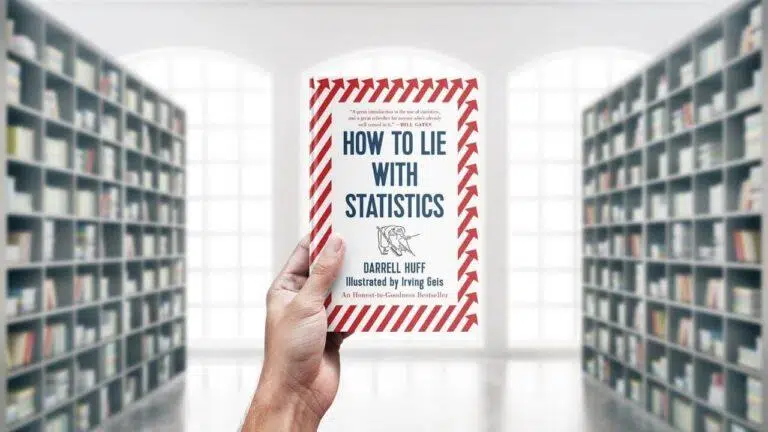
In 1954, Darrell Huff published “How to Lie With Statistics.” This influential work explores popular statistical techniques, exposing manipulative methods that seek to mislead rather than inform.
“Darrell Huff runs the gamut of every popularly used type of statistic, probes such things as the sample study, the tabulation method, the interview technique, or the way the results are derived from the figures, and points up the countless number of dodges which are used to full rather than to inform.“
Despite over half a century since its publication, Bill Gates pointed out that the book’s insights are more relevant than ever. The key takeaways from each of its ten chapters are discussed in the following sections.
Interested in purchasing “How to Lie With Statistics”? Click here!
This chapter introduces the concept of sampling bias. You can obtain the desired outcome if you manipulate the sample selection to corroborate your views.
Bias emerges when random data selection is compromised. Theoretically, each data point should have an equal chance of being chosen for the sample, but biased sampling disregards this principle.
In practice, sample selection can be guided according to the desired result. For instance, the design and application of an interview can be manipulated to induce specific responses. This realm is rife with opportunities for deception and fraud.
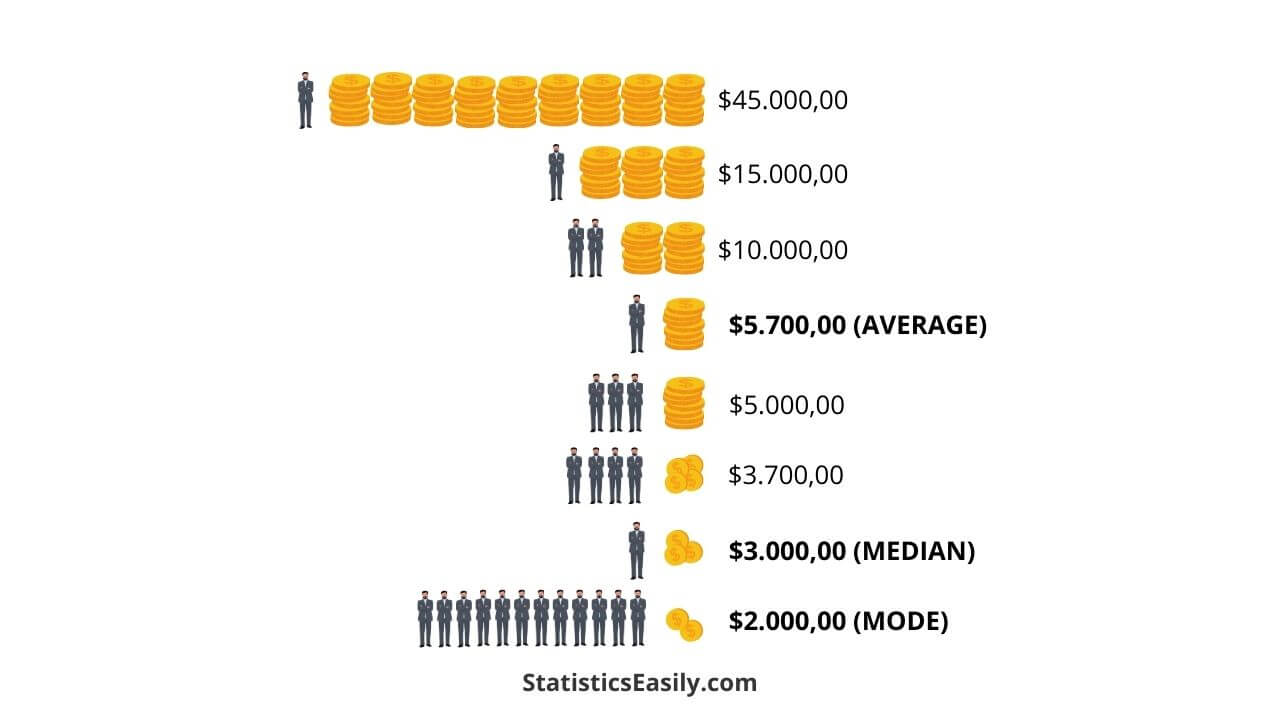
In this section, Huff explains how to select the measure of central tendency that yields the value most conducive to your argument. Critical measures of central tendency include the arithmetic mean, median, and mode.
For instance, consider a bar with nine customers, each with respective annual incomes of 15, 15, 16, 18, 20, 20, 21, 21, and 84 thousand dollars. The mean income is $26,000, while the median is $20,000.
Suppose Bill Gates walks into the bar with an annual income of $10 million. The mean income skyrockets to $1 million, but the median remains at $20,000. Hence, the bar owner could now claim that his customers have an average annual income of about $1 million!
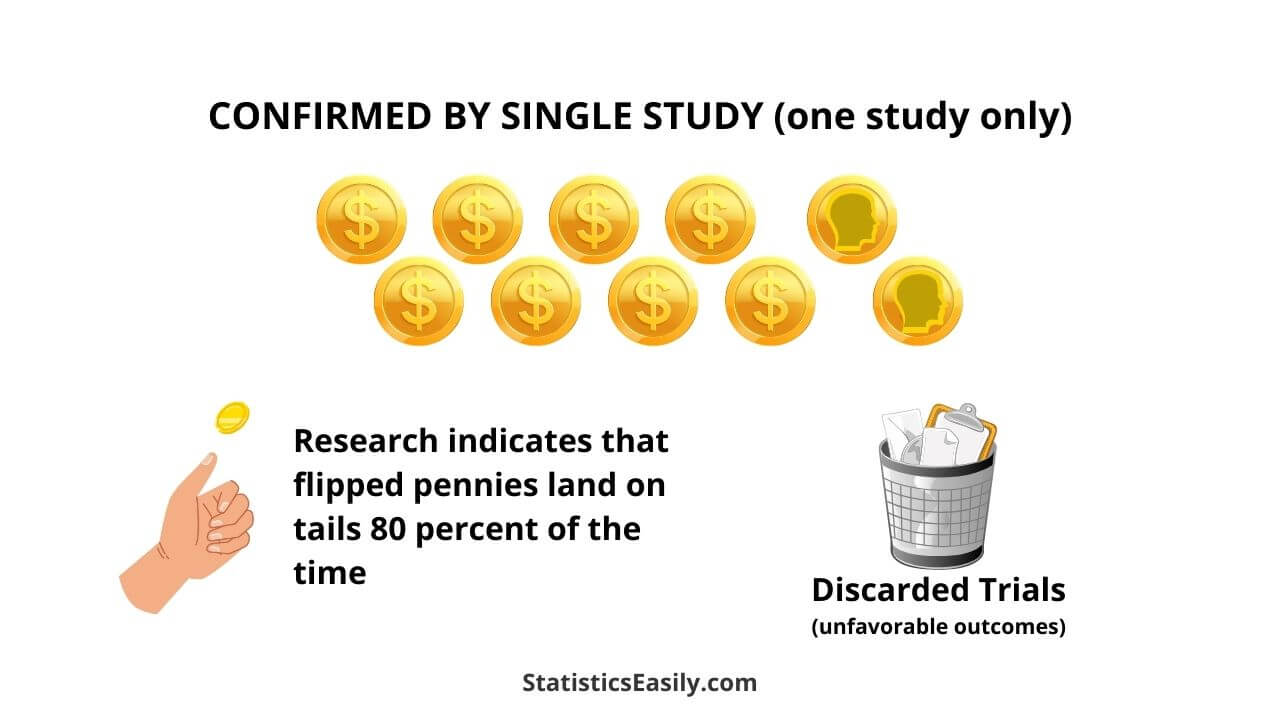
Omitting data usually indicates an attempt to conceal an issue. This chapter highlights the importance of sample size.
When dealing with a small sample, chance can significantly skew the results. Larger samples dilute chance deviations, yielding results more representative of the population.
Some companies repeatedly conduct experiments with small groups until they obtain a result that suits their agenda. This skewed outcome is then propagated through the company’s advertising.
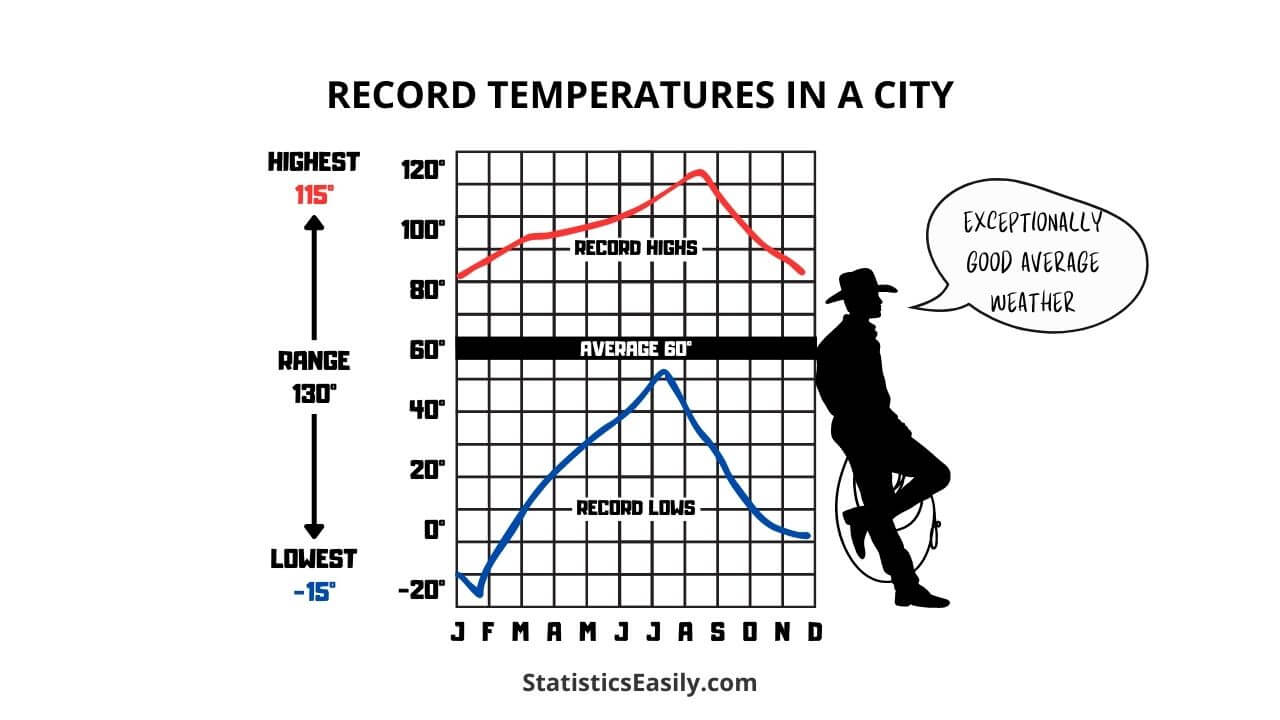
Often, presenting a value comparatively is the most effective approach. For example, a graph with missing data conveys nothing to the discerning viewer but can mislead the distracted.
This chapter also explores how presenting an average without any measure of variability can lead to misunderstanding, especially among those who need to pay more attention.
Huff discusses measurement errors in this chapter and emphasizes the importance of utilizing confidence intervals to manage them. Such errors are inherent in all sampling processes. Therefore, they should be considered, as a sample will never perfectly represent its parent population.
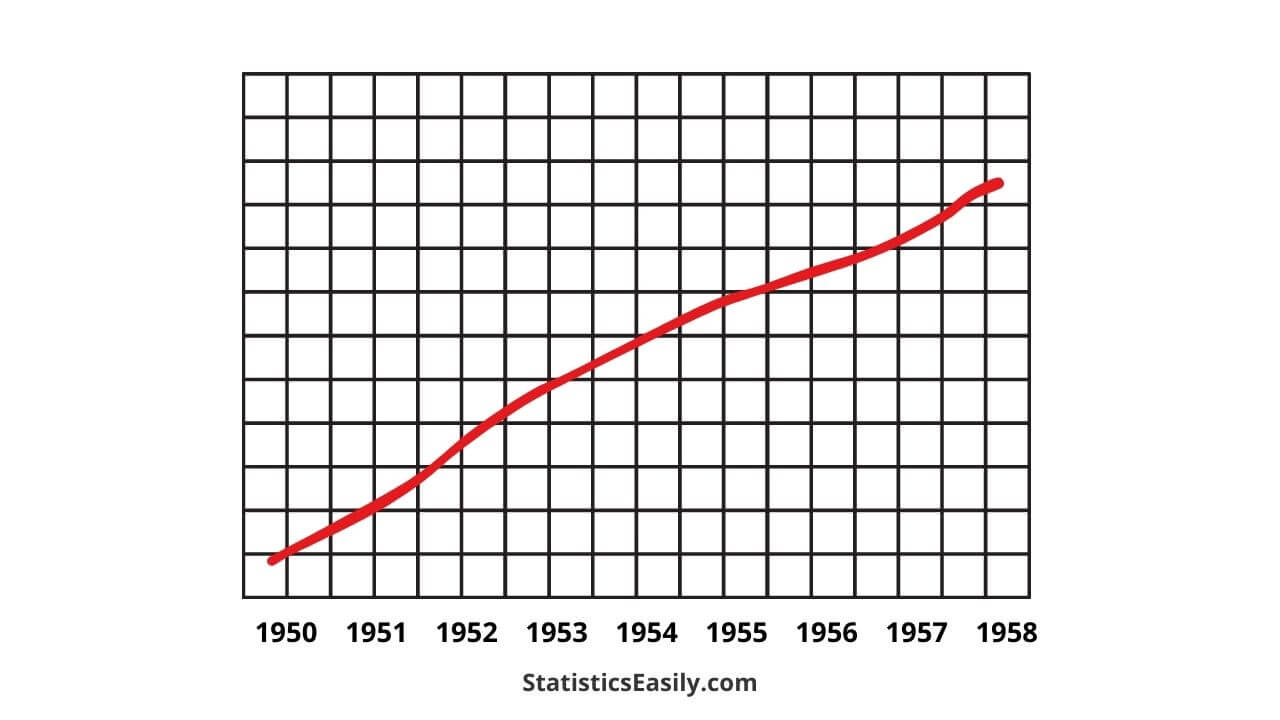
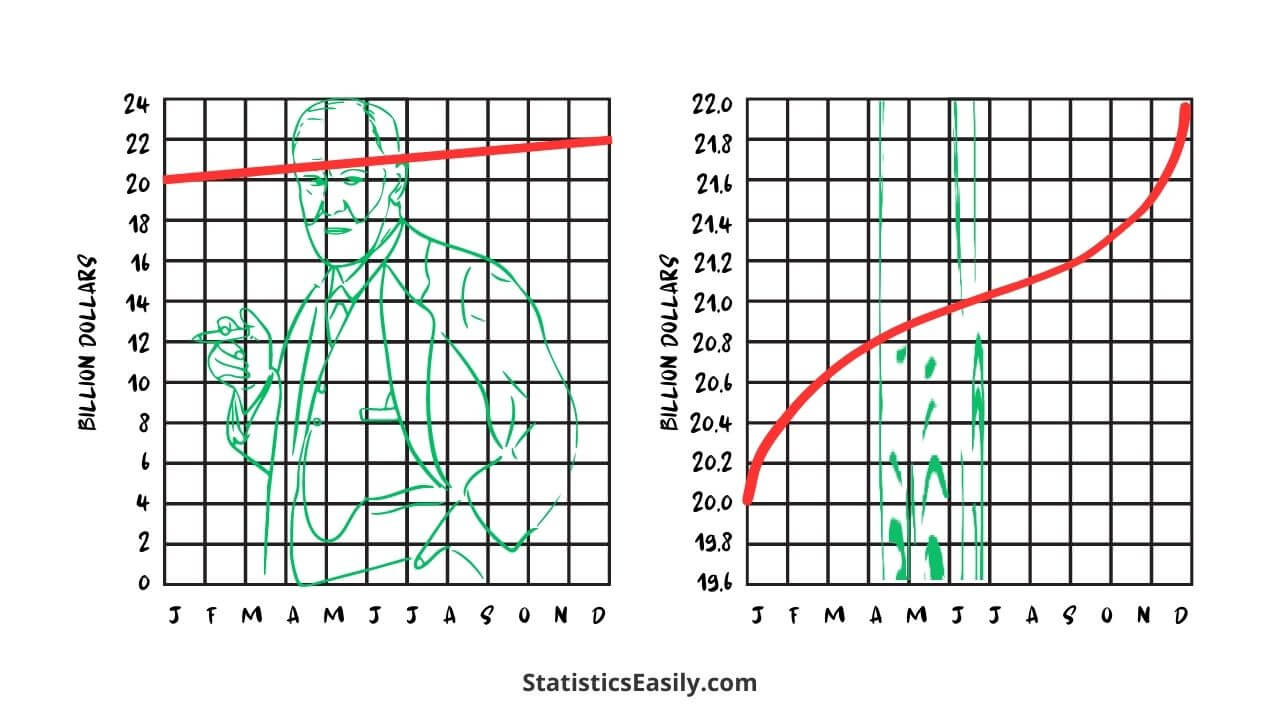
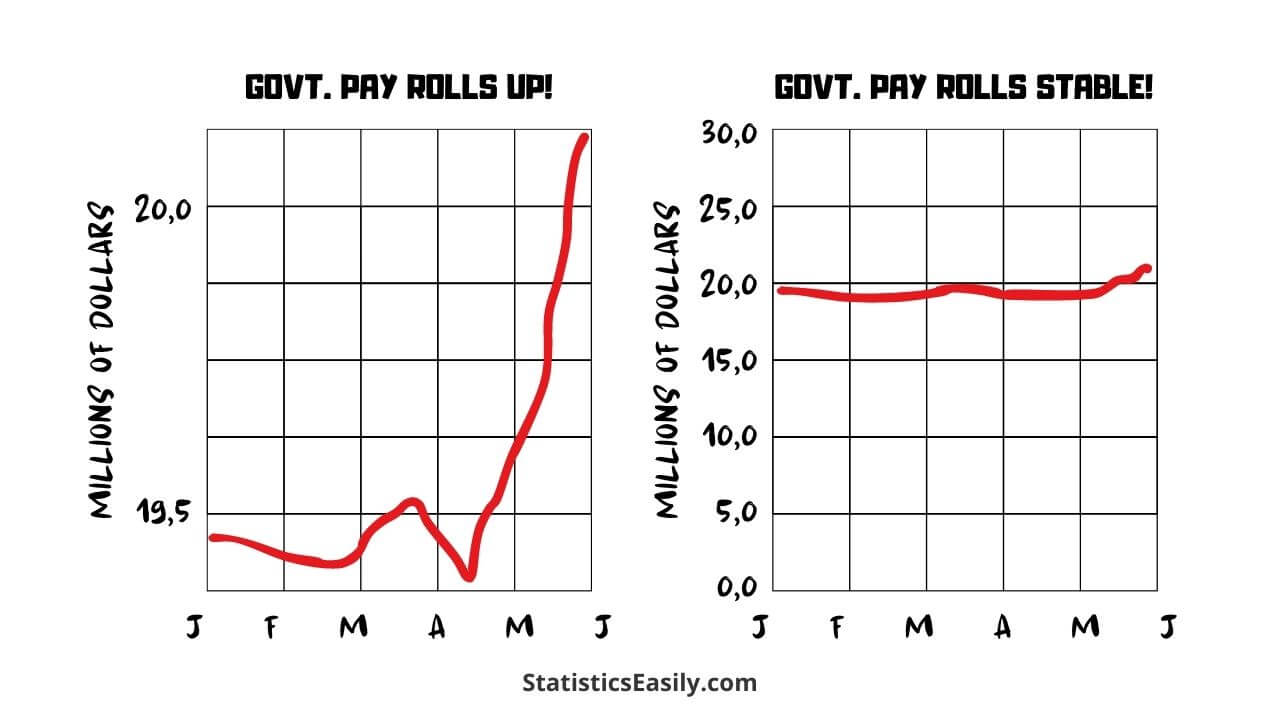
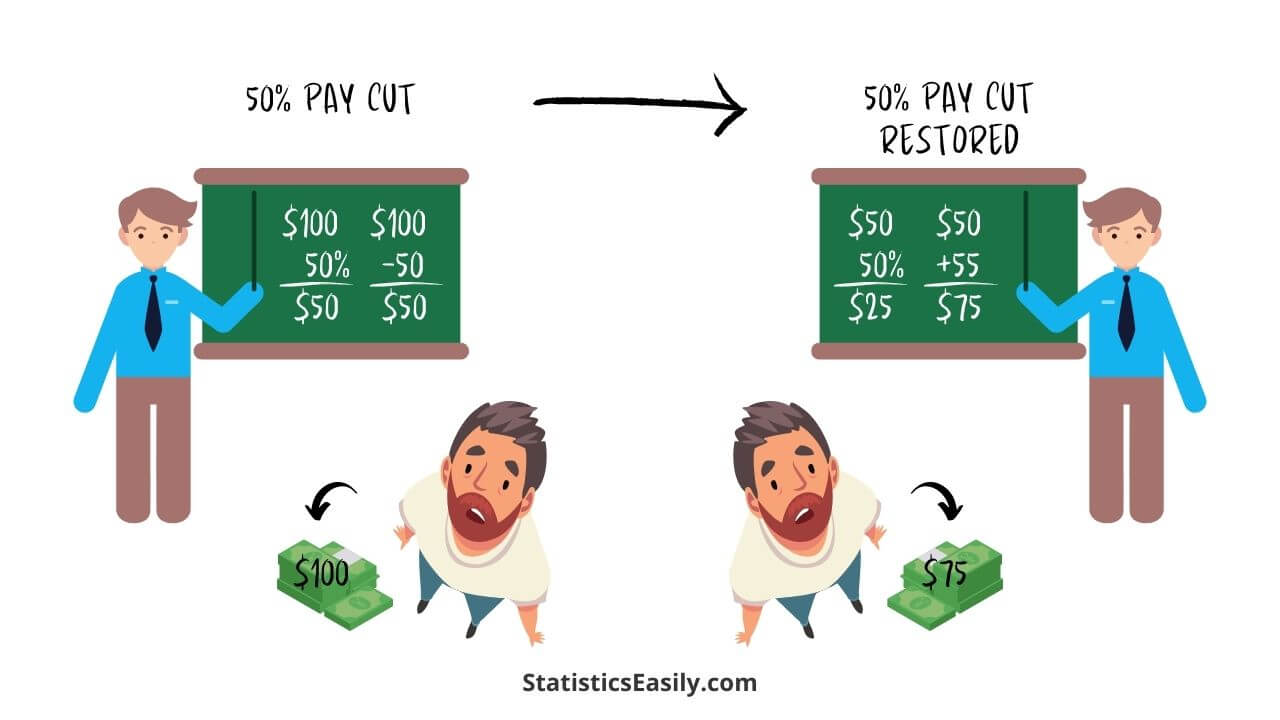
Manipulating graphical representations is a powerful method to deceive the unwary. By altering the graph’s perspective, specific facts can be emphasized disproportionately.
Truncating a portion of the graph or distorting the axes’ proportions can significantly alter the message.
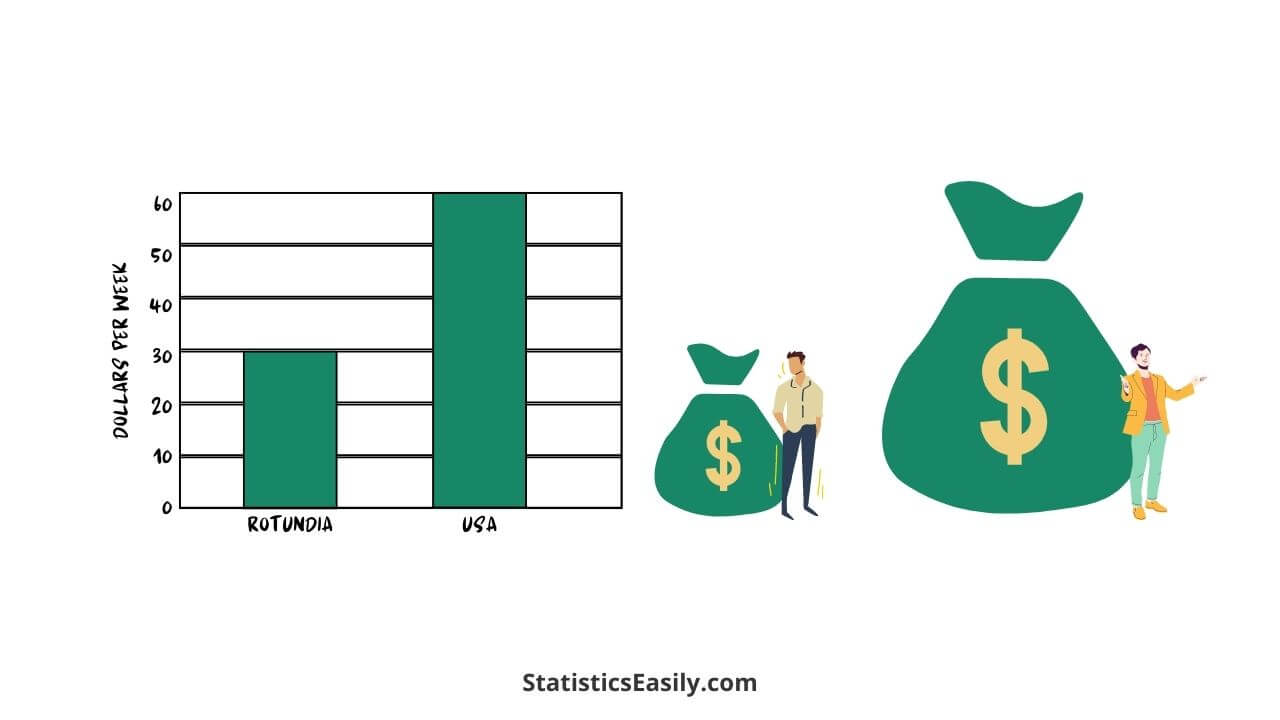
This form of manipulation capitalizes on visual appeal. The same data can be represented in an appropriately shaped graph and a misleading pictogram.
For instance, if the height of a money bag graphic is doubled, its area quadruples, which can exaggerate perceived differences.
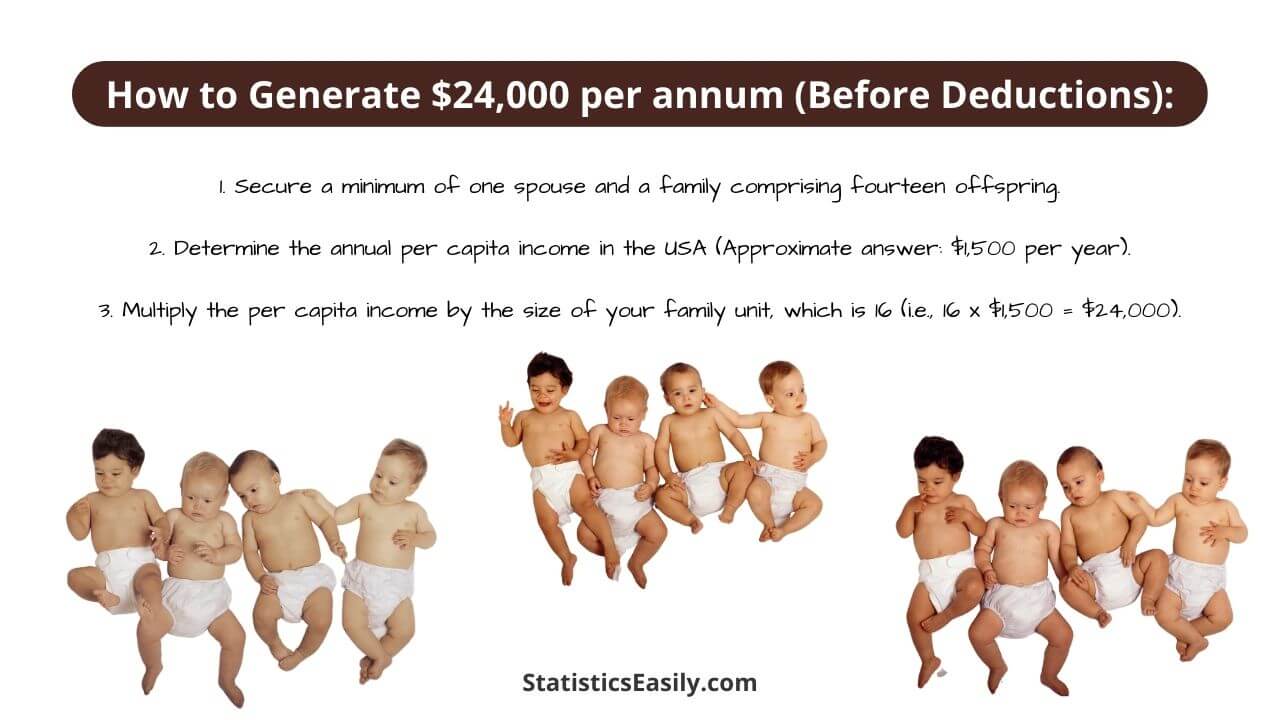
This manipulative technique rests on the principle: “If you can’t prove what you want, demonstrate something else and pretend they are the same thing.“
“You can’t prove that your nstrum cures colds, but you can publish (in large type) a sworn laboratory report that half an ounce of the stuff killed 31,108 germs ina a test tube in eleven seconds.”
For example, claiming more people died in airplane accidents last year than in 1910 does not necessarily mean modern planes are more dangerous. As a result, air travel volume has grown exponentially since 1910, which this deceptive assertion conveniently overlooks.
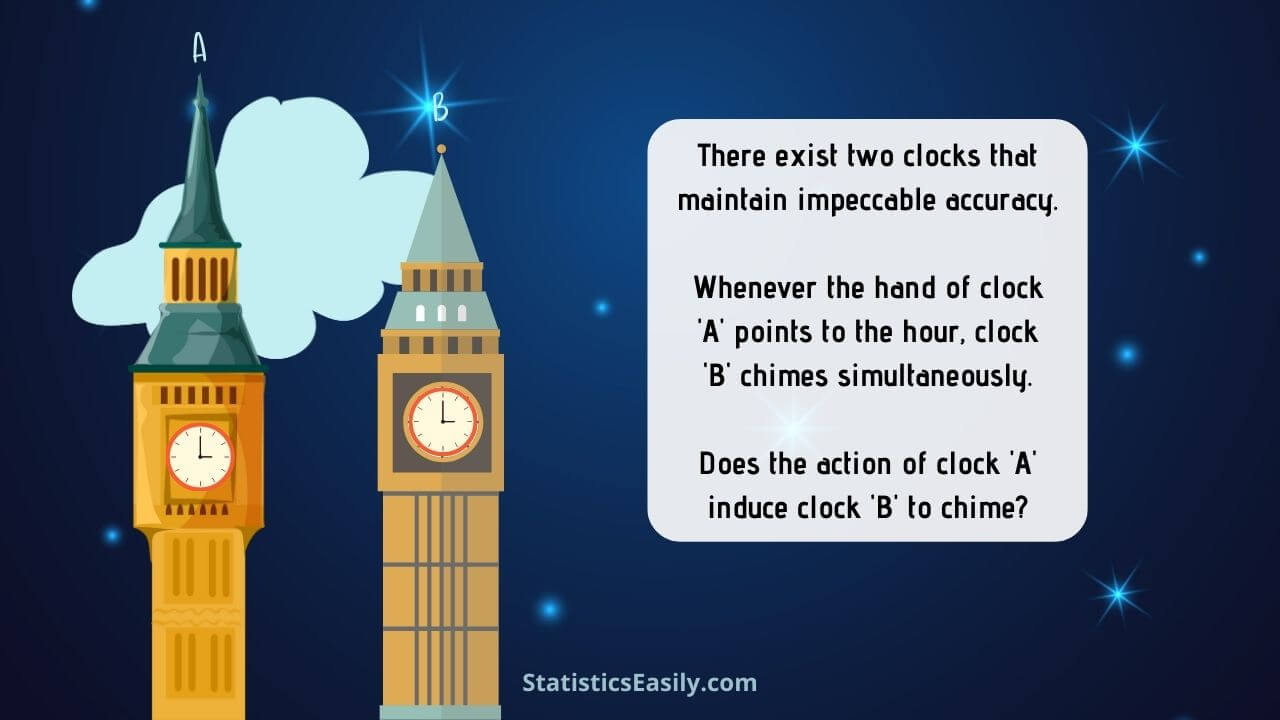
Correlation does not imply causation! This chapter underscores this crucial concept.
The post hoc logical fallacy asserts that A must have caused B if B follows A.
However, two variables moving together does not always imply a cause-and-effect relationship.
“It ain’t so much the things we don’t know that get us into trouble. It’s the things we know that ain’t so.”
Artemus Ward, American writer
Distributing false information via statistical data is termed ‘statisticulation.’ This chapter delves into using statistical manipulations to craft a lie.
For instance, in a scientific study, a researcher may be inclined (consciously or subconsciously) to favor an argument they wish to validate.
To identify errors, issues, or malicious intent, always ask these five basic questions:
#01 Who is telling?
There must be no partiality, bias, or conflicts of interest on the part of those responsible.
#02 How does he know?
The sample should be representative and adequate to allow a reliable conclusion.
#03 What is missing?
There should be no missing information, such as sample size, statistical errors, measures of variability, or any other essential population characteristics and analyses.
#04 Has anyone changed the subject?
The question and the answer should deal with the same subject.
#05 Does it make sense?
Ask about the use of nonsense numbers.
“How to Lie with Statistics” is essential for developing statistical literacy and guarding against everyday manipulation.
We strongly recommend it to researchers, professionals, students, and the general public.
For more insights into how statistics can be used to distort information, read our informative article “Statistics and Fake News.”
For more tips on using statistics to manipulate information, read our excellent article entitled “Statistics and Fake News.”
Interested in acquiring this classic book, “How to Lie With Statistics”? Click here!

Master “How do you calculate degrees of freedom” in statistical analysis to enhance data accuracy and insights.
Explore the key statistics concept, Absolute Mean Deviation, its advantages, calculation process, and practical application.

Explore the intricacies of the null hypothesis in chi square testing and its role in statistical analysis. Discover common misconceptions and practical applications.

Master the Student’s t-test to accurately compare population means, ensuring valid conclusions in your research. Avoid common pitfalls and enhance data analysis.

Discover how Florence Nightingale used data visualization and pie charts to revolutionize healthcare during the Crimean War.
Understand the complexities of ‘sampling bias’ in our comprehensive guide, detailing its impact on statistical analysis and data science.