Correlation vs Causality: Understanding the Difference
Correlation vs Causality is a crucial distinction in data analysis — correlation indicates an association between variables, while causality demonstrates a cause-and-effect relationship.
Introduction
In data analysis and scientific inquiry, distinguishing between correlation vs causality is a cornerstone of accurate interpretation and understanding. This critical differentiation shapes the foundation upon which robust research methodologies are built. It ensures the integrity of conclusions drawn from empirical data.
Correlation, the statistical measure that describes the degree to which two variables move about each other, often serves as a preliminary indicator of a potential relationship. However, the concept of causation, the assertion that a change in one variable is responsible for a change in another, encapsulates the essence of cause-and-effect dynamics. The conflation of these two concepts can lead to erroneous conclusions, misguiding policy, research, and general understanding.
This article aims to elucidate the nuanced distinction between correlation and causation, highlight common misconceptions, and provide insight into the methodologies that can more accurately determine causal relationships. Through this exploration, we seek to equip readers with the analytical tools necessary to navigate the complex landscape of data-driven insights, fostering a deeper appreciation for the intricacies of scientific investigation and the pursuit of truth in the empirical world.
Highlights
- Correlation shows an association between variables but doesn’t imply causation.
- Causality refers to a cause-and-effect relationship between variables.
- Confounding factors can lead to spurious correlations and misleading conclusions.
- Reverse causation can cause incorrect assumptions about the direction of causality.
- Overgeneralization from a limited dataset can result in false conclusions.
Ad Title
Ad description. Lorem ipsum dolor sit amet, consectetur adipiscing elit.
Correlation vs Causality
Understanding the difference between correlation vs causality is essential to draw accurate data analysis and statistics conclusions.
Correlation refers to the relationship between 2 variables, where changes in one variable are associated with changes in the other. When 2 variables are correlated, they tend to move in a particular direction, either positively or negatively. A positive correlation indicates that both variables increase or decrease together. In contrast, a negative correlation means that as one variable decreases, the other increases, and vice versa. It is essential to mention that correlation does not imply causation but merely signifies an association between variables.
Causality, on the other hand, refers to a cause-and-effect relationship between two variables. In a causal relationship, changes in one variable directly cause changes in the other variable. Establishing causality goes beyond identifying a correlation. It requires clearly demonstrating that one variable influences the other, ruling out the possibility of external factors or mere coincidences causing the observed association.
Summarizing, correlation and causality are related concepts but not synonymous. Correlation describes the association between two variables, whereas causality demonstrates a cause-and-effect relationship.
Correlation vs Causality Common Misconceptions
Correlation implies causation: One of the most common misconceptions is the belief that if two variables are correlated, one must cause the other. While correlation can suggest a potential causal relationship, it does not prove causation. Correlation shows a relationship between two variables, which could result from coincidence, confounding factors, or reverse causation.
Ignoring confounding factors: A confounding factor is a third variable that affects both the independent and dependent variables, leading to a spurious correlation. Failing to account for confounding factors can result in misleading conclusions about the causal relationship between the variables of interest. Therefore, controlling for potential confounding factors in the analysis is essential to identify causality.
Reverse causation: Another pitfall related to correlation and causality is reverse causation, where the causal relationship between two variables is opposite to what is assumed. This can occur when the presumed dependent variable influences the presumed independent variable rather than the other way around. Awareness of the possibility of reverse causation can help analysts avoid drawing incorrect conclusions about the direction of causality.
Overgeneralization: Sometimes, analysts overgeneralize the relationship between two variables based on a limited dataset or a specific context. Just because a correlation or causal relationship is observed in one situation does not mean it will hold in every context. Therefore, it is essential to be cautious about generalizing results and to consider potential limitations and boundary conditions.
Overreliance on statistical significance: While statistical significance is an essential component of data analysis, it should not be the sole criterion for determining the existence of a relationship between variables. A statistically significant correlation does not guarantee causation. Therefore, it is crucial to consider other factors, such as the effect size, sample size, and the plausibility of the relationship, in light of existing knowledge and theory.
Correlation vs Causality Examples
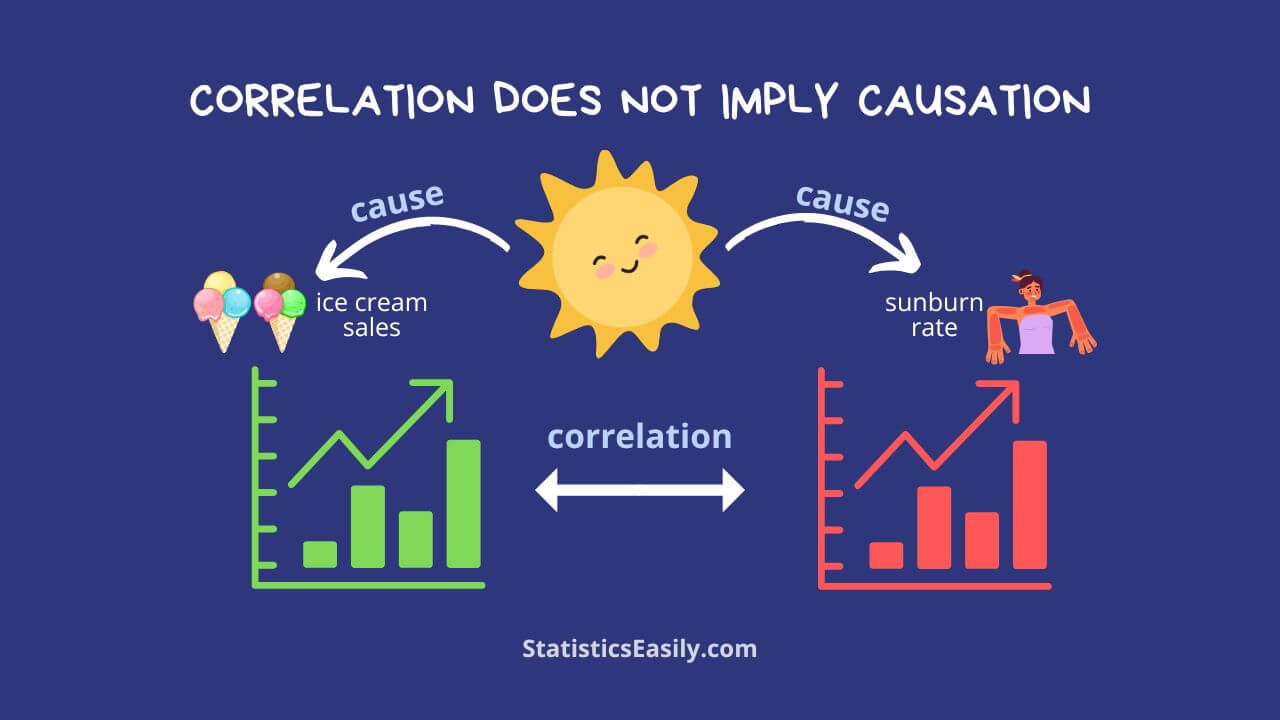
Ice cream sales and drowning incidents: Ice cream sales and the number of drowning incidents are positively correlated. However, this does not mean that ice cream sales cause drownings. The underlying factor is the hot weather, leading to increased ice cream consumption and more people swimming, thus increasing the risk of drowning. In this case, the hot weather acts as a confounding variable.
Number of firefighters and the damage caused by fires: In some instances, data may show a positive correlation between the number of firefighters at a fire scene and the damage caused by the fire. This correlation does not mean firefighters cause more damage; larger fires require more firefighters and tend to cause more damage. Here, the size of the fire is the confounding variable.
Education level and income: Data often reveals a positive correlation between a person’s education level and income. While this correlation might suggest that higher education causes higher income, it is essential to consider other factors that could influence this relationship, such as individual abilities, work experience, and social networks. The correlation between education and income does not guarantee a causal relationship.
Pirate population and global temperature: A humorous example often cited to demonstrate the distinction between correlation and causality is the decrease in the number of pirates over the past centuries and the increase in global temperature. Though the data might show an inverse correlation between the pirate population and global temperature, it is absurd to suggest that the decline in pirates causes global warming.
Strategies for Identifying Causation in Data Analysis
Establishing causality is critical to data analysis, allowing researchers to infer cause-and-effect relationships between variables. Identifying causality can be challenging, but several strategies can help analysts determine if a causal relationship exists. This section outlines some key strategies for identifying causality in data analysis.
- Controlled experiments: These experiments involve manipulating an independent variable and measuring its impact on a dependent variable to establish causality. Random assignment and controlling confounding factors help isolate the causal effect.
- Natural experiments: When controlled experiments are not possible or ethical, natural experiments can estimate causal effects by comparing groups exposed to naturally occurring conditions that resemble a controlled experiment.
- Longitudinal studies: These studies collect data on subjects over time, examining how changes in variables relate to one another. Temporal precedence is crucial for establishing causality.
- Granger causality: A time series analysis approach determining if one-time series can predict another, providing evidence of causality through lagged relationships between variables but not guaranteeing cause-and-effect.
- Instrumental variables: This technique estimates causal relationships in the presence of confounding factors by identifying an instrument related to the independent variable but not affected by confounding factors.
- Regression discontinuity design: A quasi-experimental method estimating causal effects by comparing observations near a threshold, assessing treatment impact while accounting for confounding factors.
- Meta-analysis: Combines multiple studies’ results to estimate overall effect size, examining causal relationship consistency and strength across studies and identifying potential moderators.
- Propensity score matching: Controls selection bias in observational studies by matching treatment and control groups based on covariates predicting treatment assignment likelihood and estimating causal effects while controlling confounding factors.
- Difference-in-differences: A quasi-experimental method comparing variable outcome changes between treatment and control groups over time, estimating causal effects while controlling confounding factors.
- Mediation analysis: Examines how an independent variable affects a dependent variable via mediator variables, establishing a causal pathway.
- Moderation analysis: Investigates conditions under which relationships between variables change, identifying when causal relationships are stronger or weaker.
- Counterfactual analysis: Estimates causal effects by determining what would have happened if a treatment had not been applied or a different treatment had been applied, controlling confounding factors.
- Fixed Effects Models: Controls unobserved time-invariant factors in panel data analysis, estimating the causal effect of the independent variable on the dependent variable.
Ad Title
Ad description. Lorem ipsum dolor sit amet, consectetur adipiscing elit.
Conclusion
The distinction between correlation and causation is foundational to robust data analysis and critical thinking. This article has elucidated that correlations indicate associations between variables but do not necessarily imply a causal relationship. Understanding this distinction prevents the common pitfalls of misinterpreting data, such as overlooking confounding factors, reverse causation, and the dangers of overgeneralization and overreliance on statistical significance.
The examples, ranging from ice cream sales and drowning incidents to the humorous correlation between pirates and global warming, illustrate the complexity and nuance involved in discerning authentic causative relationships from mere correlations. Moreover, the outlined strategies for identifying causation, including controlled experiments, natural experiments, and longitudinal studies, offer valuable methodologies for researchers to establish more definitive cause-and-effect relationships.
As we navigate an era inundated with data, the ability to differentiate between correlation and causation becomes a skill of scientific inquiry and a fundamental literacy for informed decision-making and critical analysis in various domains of knowledge and everyday life.
Recommended Reading
- Confounding Variables in Statistics: Strategies for Identifying and Adjusting
- Ice Cream and Polio: Understanding Correlation vs Causation
- Correlation in Statistics (Story)
- Strategies for Identifying Causation (Story)
- Correlation vs Causation: The Critical Divide (Story)
- How to Distinguish Correlation From Causation (External Link)
FAQ: Correlation vs Causality
Correlation describes the association between variables, while causality demonstrates a cause-and-effect relationship.
No, correlation does not imply causation. Correlation shows a relationship between variables, but this may not be due to a cause-and-effect relationship.
A confounding factor is a third variable that affects the independent and dependent variables, leading to a spurious correlation.
Reverse causation refers to a condition in which the assumed causal relationship between two variables is reversed, meaning that the effect influences the cause instead of the cause influencing the effect. This can lead to wrong conclusions about the direction of causality.
Overgeneralization can lead to false conclusions if the relationship between variables is assumed to hold true in every context without considering potential limitations or boundary conditions.
Strategies include controlled experiments, natural experiments, longitudinal studies, Granger causality, instrumental variables, and regression discontinuity design.
Controlled experiments manipulate an independent variable and measure its effect on a dependent variable, isolating the causal effect by controlling for potential confounding factors.
A natural experiment is a study that relies on naturally occurring events or situations that mimic the conditions of a controlled experiment, allowing researchers to estimate causal effects.
Longitudinal studies collect data on the same subjects over time, examining how changes in one variable are associated with changes in another, helping to establish temporal precedence in causality.
An instrumental variable is a variable related to the independent variable but not affected by confounding factors used to isolate the causal effect of the independent variable on the dependent variable.


Apreciables señore.
Excelente articulo, enfoque muy bien detallado, entendible , y practico para la aplicación. Muy complacido.
Thank you very much, Nicolás. I truly appreciate your kind words. I’m glad to hear that the article was detailed, practical, and easy to understand. That’s exactly our goal — to make statistics accessible and applicable. All the best in your studies and work!