Correlation in Statistics: Understanding the Link Between Variables
You will learn the crucial role of correlation in statistics — interpreting statistical relationships between variables.
Introduction
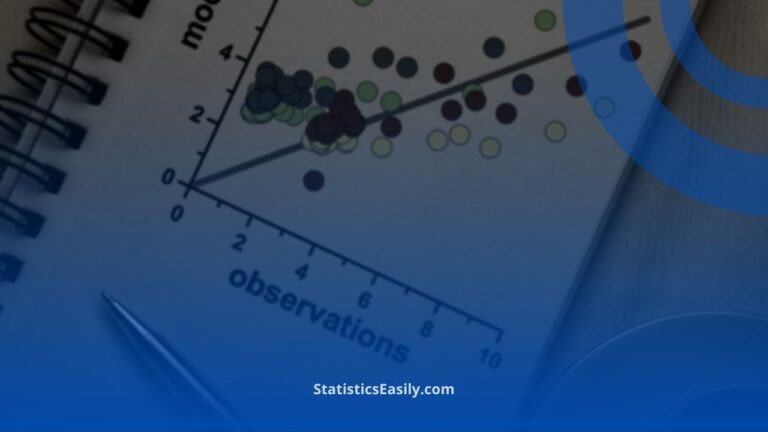
The concept of correlation is akin to a compass in navigation — it guides us through the sea of data, revealing the direction and strength of relationships between pairs of variables. At its heart, correlation answers a fundamental question: When one variable changes, does another variable change with it, and if so, how consistently?
Understanding correlation is not just a matter of academic interest; it’s a cornerstone for data analysis across various domains, from predicting stock market trends to determining the efficacy of a new drug. This concept helps us make sense of the world by uncovering hidden patterns that can inform decision-making and lead to groundbreaking discoveries.
In this article, we will delve into the essence of correlation in statistics, laying bare its principles, computations, applications, and best practices for reporting. We’ll differentiate between types of correlation, such as Pearson and Spearman, unravel the common confusion with causation, and explore how modern software can be used to calculate correlation coefficients. Real-world examples will illustrate the practicality of correlation in fields such as finance and healthcare. In contrast, advanced topics like partial correlation will show the depth of insights that can be gained. Finally, we’ll discuss ethical considerations and the importance of clear communication when presenting correlation findings.
Highlights
- Correlation coefficients quantify the strength and direction of a relationship between two variables.
- Pearson and Spearman coefficients cater to different data types and distributions.
- Correlation is not causation; it does not imply one variable causes changes in another.
- Partial correlation assesses the relationship between two variables while controlling for a third.
- Reporting correlation must consider ethical practices and clear communication of results.
Ad Title
Ad description. Lorem ipsum dolor sit amet, consectetur adipiscing elit.
Understanding Correlation
Correlation in statistics is a measure that tells us the degree to which two variables move about each other. Regarding correlation, particularly in statistics, we refer to how two data sets correspond. This could mean that when one set of data increases, the other set either increases or decreases, depending on the type of correlation.
Pearson’s correlation coefficient, often denoted as ‘r,’ is the most widely used correlation measure. It quantifies how a line can describe a relationship between two variables. This type of correlation is used for continuous data where the relationship between variables is linear.
Spearman’s rank correlation, on the other hand, is a non-parametric measure of rank correlation. It assesses how well a monotonic function can describe the relationship between two variables. This is particularly useful when the data doesn’t meet the assumptions necessary to use Pearson’s correlation effectively, such as when the data is ordinal or not normally distributed.
A key point to remember is that correlation is not causation. Because two variables display a strong correlation, it does not mean that one variable causes the other to change. Correlation indicates that there is a relationship between the two variables. Causation goes one step further to state that one variable causes the other to change.
For example, ice cream sales and drowning incidents are correlated because they both tend to be higher in the summer, but buying ice cream doesn’t cause drowning incidents. There’s a lurking variable — temperature — that is causing both. This is why statistical analysis must be approached critically and why researchers look for evidence beyond correlation to conclude causation.
Computing Correlation Coefficients
Calculating correlation coefficients is a fundamental part of statistical analysis, as it allows us to quantify the relationship between two variables. The two most common coefficients are Pearson’s r and Spearman’s rho.
Pearson’s r is used when the relationship we’re examining is linear, and both variables are continuous and normally distributed. The formula for Pearson’s r is:
r = Σ(xy) / sqrt(Σx^2 * Σy^2)
This formula takes the sum of the product of paired scores, divided by the product of their standard deviations.
On the other hand, Spearman’s rho is a non-parametric measure that assesses the monotonic relationship between two variables — whether as one variable increases, the other tends to increase (or decrease), but not necessarily at a constant rate. It is the Pearson’s r coefficient applied to rank-ordered variables. It is used when the assumptions for Pearson’s r are not met, mainly when the data is ordinal or not normally distributed.
To calculate these coefficients, statistical software like R, Python, or Excel can be used. For example, in R, the cor() function can be applied:
cor(x, y, method = c(“pearson”, “spearman”))
In Python, the scipy.stats package contains pearsonr() and spearmanr() functions:
from scipy.stats import pearsonr, spearmanr
pearson_coefficient, _ = pearsonr(x, y)
spearman_coefficient, _ = spearmanr(x, y)
For those working in Excel, the CORREL function can be used for Pearson’s r:
=CORREL(array1, array2)
While there is no direct function for Spearman’s rho in Excel, it can be calculated by first ranking the data points and then applying the CORREL function to these ranks.
Interpreting correlation coefficients involves considering the relationship’s direction and magnitude. A positive coefficient indicates that as one variable increases, so does the other. In comparison, a negative coefficient indicates that as one variable increases, the further decreases. The closer the coefficient is to 1 or -1, the stronger the relationship. A coefficient of 0 indicates no linear relationship.
It’s essential to note that a correlation coefficient alone does not imply causation and can be influenced by outliers or non-linear relationships. Furthermore, the strength of the correlation does not measure the slope of the relationship but rather the consistency of the ratio of change.
When you report correlation findings in research, it is crucial to provide context. This includes discussing potential confounding variables, the possibility of causation when appropriate, and the practical implications of the correlation observed. Always aim for clarity and precision in your communication to avoid common misinterpretations of correlation coefficients.
Ad Title
Ad description. Lorem ipsum dolor sit amet, consectetur adipiscing elit.
Applications of Correlation in Real-world Data Analysis
Correlation in real-world data analysis spans various fields, proving to be a versatile tool for interpreting relationships within data.
In finance, correlation is pivotal in portfolio management. Financial analysts use correlation to diversify assets to reduce risk by combining assets that do not move in tandem. For example, the correlation between stock and bond returns is often examined to ensure a balanced portfolio that can withstand market volatility.
Healthcare professionals rely on correlation in epidemiology to identify the relationship between risk factors and health outcomes. A study might find a strong correlation between sedentary lifestyles and the prevalence of cardiovascular diseases, influencing public health policies and patient counseling.
However, the application of correlation comes with limitations and potential pitfalls. A high correlation does not necessarily translate to causation. This misconception can lead to erroneous conclusions, especially in complex systems with multiple factors.
A notable case where correlation provided valuable insights was in sports analytics. By analyzing player statistics, teams can identify which metrics most strongly correlate with winning games, leading to informed decisions on training and strategy.
Another application is environmental science, where researchers find correlations between pollutant levels and climate change indicators. These studies can significantly influence environmental regulations and conservation efforts.
Despite its utility, analysts must be cautious of its limitations. Correlation coefficients can be affected by outliers, non-linear relationships, or variables that are related through a third, unaccounted-for variable. These factors can misrepresent the true nature of the relationship between the variables being studied.
In sum, while correlation is a powerful statistical tool, it must be applied with an understanding of its limitations and the context of the data to avoid the pitfalls of misinterpretation. Whether in finance, healthcare, or any other field, correlation provides a window into the complex interplay of variables that shape our world.
Advanced Topics in Correlation
When delving into advanced statistical analysis, two key concepts emerge: partial correlation and autocorrelation. These concepts extend our understanding of correlation beyond the basic Pearson and Spearman coefficients by adding complexity and depth to interpreting relationships between variables.
Partial correlation comes into play when we’re interested in understanding the relationship between two variables while controlling for the effect of one or more additional variables. This is particularly useful in complex models where variables may interact. For instance, in assessing the relationship between physical activity and heart health, partial correlation can control for the effect of age, allowing a clearer view of the direct relationship between exercise and cardiovascular condition.
On the other hand, autocorrelation refers to the correlation of a variable with itself across different time intervals. It’s a critical measure in time series analysis, where the interest lies in identifying patterns over time. For example, autocorrelation can help analyze seasonal trends in sales data, allowing businesses to plan for periods of high or low demand.
These advanced methods provide additional insights pivotal for accurate data interpretation. Partial correlation can reveal hidden relationships that are not apparent when looking at simple correlations, and autocorrelation can uncover trends and cycles in time series data that might otherwise be missed.
Understanding correlation — particularly these advanced types — is crucial in predictive modeling. Models that predict future outcomes based on historical data rely on identifying and understanding the relationships between variables. For example, in financial markets, predictive models might use autocorrelation in stock prices to inform trading strategies.
However, these advanced topics come with their own sets of challenges and limitations. With partial correlation, there’s a risk of overfitting the model to the data if too many controls are applied, which can result in misleading conclusions. Autocorrelation can violate the assumptions of classical regression models, leading to errors if not appropriately addressed.
As we integrate these advanced correlation techniques into predictive models, applying them thoughtfully is essential, ensuring that they contribute to the model’s predictive power without introducing bias or error. The role of correlation in predictive modeling is a balancing act between capturing genuine relationships and avoiding the pitfalls of overinterpretation or overfitting.
Best Practices for Reporting Correlation
When reporting correlation findings in research, it’s imperative to adhere to a set of best practices to ensure that the information is conveyed accurately and ethically. Here are some guidelines:
Be Precise and Clear: When reporting the correlation coefficient, be precise about the statistic. Include the type of correlation used (Pearson or Spearman), the value of the coefficient, and the significance level. For instance, “A Pearson correlation of r = 0.62 (p < .01) was found between…”,
Contextualize Your Findings: Present the findings within the context of the research. Explain what the correlation means in terms of the variables investigated. This could involve discussing the potential implications or applications of the relationship.
Include Visuals: Whenever possible, include scatter plots or graphs visually representing the correlation. This can help readers better understand the relationship’s nature and strength.
Address Limitations: Discuss any limitations in the analysis, such as the potential impact of outliers, the size of the dataset, or the distribution of the data. This could also involve mentioning the limitations of correlation analysis, like the inability to infer causation.
Ethical Considerations: It’s essential to consider the ethical aspects of reporting correlation findings. Avoid overstating the implications of the correlation, and be mindful of privacy concerns, especially when dealing with sensitive data.
Discuss Practical Implications: If the correlation has practical applications, discuss these and how they might influence future research or practice within the field.
Report Confidence Intervals: Providing the confidence intervals for correlation coefficients gives a range of values within which the actual correlation is likely to fall, which adds to the robustness of the reported findings.
Encourage Further Inquiry: Acknowledge that while correlation can suggest relationships, it is often just a starting point for further study. Encourage readers to consider additional research that could explore causation or related variables.
By following these best practices, researchers and analysts can ensure that their correlation reports are informative and responsible, providing valuable insights while maintaining scientific integrity. The key takeaway is that while correlation is a powerful statistical tool, it must be reported carefully to avoid misinterpretation and to guide further research effectively.
Ad Title
Ad description. Lorem ipsum dolor sit amet, consectetur adipiscing elit.
Conclusion
As we conclude our exploration into “Correlation in Statistics: Understanding the Link Between Variables,” we reflect on the significance of correlation in data analysis. This statistical measure is more than just a numerical value; it is a beacon that guides researchers through complex data, highlighting relationships between variables that might otherwise remain hidden.
Throughout this article, we’ve seen how correlation is vital in diverse fields, providing insights that drive decision-making and strategy, from finance to healthcare, from environmental studies to sports analytics. Yet, it’s crucial to approach correlation critically, recognizing that correlation does not equate to causation and that other factors may influence the relationships we observe.
Recommended Articles
In light of this, we encourage readers to continue their learning journey. Delve further into statistical methods, question the data, and seek out the stories it tells. Beyond the realms of Pearson and Spearman, the world of statistics offers endless possibilities for discovery and innovation.
Our blog offers a wealth of articles on related topics for those eager to broaden their understanding. Whether you’re interested in advanced statistical techniques, predictive modeling, or ethical data analysis practices, our resources are designed to support and inspire both novices and seasoned professionals.
By embracing the power of statistics and committing to lifelong learning, we can uncover deeper insights, make more informed decisions, and contribute to advancing knowledge across various domains.
Continue your exploration with our latest articles and discussions at https://statisticseasily.com/, where the quest for understanding never ends.
Frequently Asked Questions (FAQs)
Q1: What is a correlation coefficient? It’s a statistical measure that describes the extent to which two variables move about each other.
Q2: How do you calculate the Pearson correlation coefficient? Pearson’s coefficient is calculated as the covariance of two variables divided by the product of their standard deviations.
Q3: Can correlation imply causation? No, correlation alone does not mean causation. It only indicates a relationship, not a cause-and-effect link.
Q4: What is Spearman’s rank correlation? Spearman’s correlation assesses the relationship between two ranked variables, used when the data is not normally distributed.
Q5: What is a ‘strong’ correlation? A strong correlation typically refers to a coefficient close to 1 or -1, indicating a strong relationship between variables.
Q6: How does correlation differ from regression? Correlation measures the strength of a relationship, while regression describes the nature of the relationship between variables.
Q7: What is partial correlation? Partial correlation measures the degree of association between two variables, with the effect of a third variable removed.
Q8: Why is it important to report the confidence interval of a correlation coefficient? The confidence interval provides a range within which the correlation coefficient is likely to lie with a certain confidence level.
Q9: Can two variables have a zero correlation? Zero correlation means there is no linear relationship between the variables, but they could have a non-linear relationship.
Q10: How can outliers affect correlation? Outliers can significantly skew correlation coefficients, leading to misleading interpretations of the data relationship.