Understanding Spearman Correlation in Data Analysis
Spearman Correlation, also known as Spearman’s rank correlation coefficient, is a statistical measure that assesses the direction and strength of a monotonic relationship between two ranked variables. It’s handy for ordinal data or when assumptions for Pearson’s correlation are violated.
Introduction
In statistics and data science, correlation is a fundamental concept used to measure the degree to which two variables move with each other. In this article, we’ll dive into one specific type of correlation called the Spearman’s Rank Correlation.
Highlights
- Spearman correlation assesses the monotonic relationship between two ranked variables.
- Spearman’s Rank Correlation is ideal for data that isn’t normally distributed or lacks a linear relationship.
- The choice between Spearman and Pearson depends on your data and research question.
- Correlation coefficients range from -1 to +1, indicating negative and positive correlation.
- Correlation does not imply causation.
Ad Title
Ad description. Lorem ipsum dolor sit amet, consectetur adipiscing elit.
The Basics of Spearman Correlation
Spearman correlation, also known as Spearman’s rank correlation coefficient, is a non-parametric measure of statistical dependence between two variables. It evaluates how much a monotonic function can accurately describe the relationship between two variables. In simpler terms, it measures the strength and direction of the relationship between 2 ranked variables.
The Spearman correlation is beneficial when dealing with data that does not meet the assumptions of Pearson’s correlation, specifically data that is not normally distributed or lacks a linear relationship. More about this will be discussed in the subsequent section. As a non-parametric test, the Spearman correlation is appropriate for ordinal or continuous data that has violated the assumptions of Pearson’s correlation.
Spearman Correlation vs. Pearson Correlation
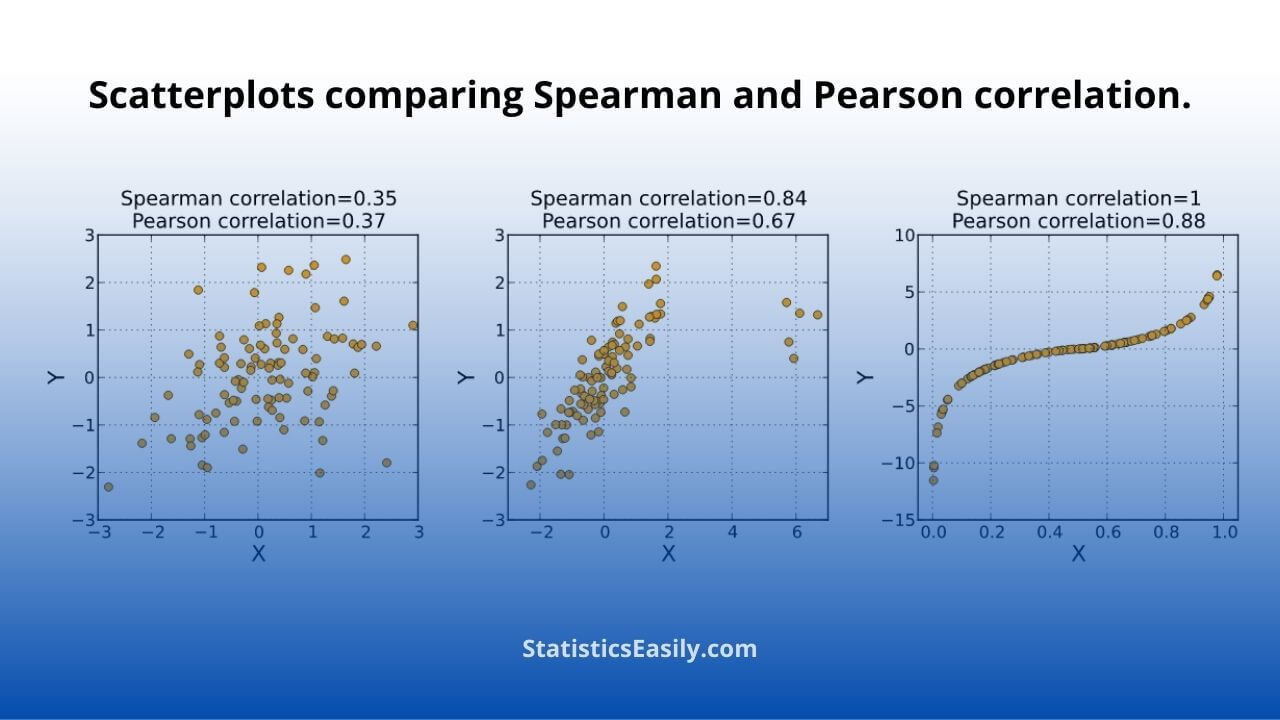
The Pearson correlation, named after Karl Pearson, measures the linear relationship between two continuous variables. The Spearman’s Rank Correlation calculates the strength and direction of the monotonic relationship between 2 variables, which may not be linear.
In other words, Pearson correlation is best suited for normally distributed data with a linear relationship. In contrast, the Spearman correlation is a better option for data that doesn’t meet these assumptions. However, this doesn’t mean that Pearson’s correlation is always better than Spearman’s. Therefore, when deciding whether to use Pearson or Spearman correlation, it’s essential to consider the type of data you have and the specific questions you’re trying to answer through your analysis.
The 3 Types of Correlation
There are three types of correlation coefficients commonly used:
Pearson Correlation: This is the most common method to measure correlation. It assesses the linear relationship between two continuous variables.
Spearman Correlation: It is used when data is ordinal or when assumptions of Pearson’s correlation are violated.
Kendall Tau: It is used for small data sets and measures the ordinal association between two measured quantities.
Additionally, it’s worth noting that correlation coefficients can take a range of values from -1 to +1. For example, a value closer to +1 or -1 indicates a strong positive or negative correlation.
Spearman Correlation in the Context of Causality and Regression Analysis
It is crucial to understand that correlation does not necessarily indicate causation. Just because two variables have a strong Spearman’s Rank Correlation, it doesn’t mean one variable causes the other to occur. A classic adage to remember is correlation does not imply causality.
Correlation, including Spearman correlation, is also a key concept in regression analysis. Regression analysis is a group of statistical techniques used to determine the connection between a dependent variable and one or more independent variables. In regression analysis, the strength of the correlation between the independent and dependent variables can significantly affect the model’s ability to predict outcomes accurately. For a deeper dive into this, visit our blog post about Regression Analysis.
Ad Title
Ad description. Lorem ipsum dolor sit amet, consectetur adipiscing elit.
Conclusion
The Spearman’s Rank Correlation offers a robust method to measure the strength and direction of the monotonic relationship between two variables. This is particularly useful when dealing with ordinal data or when assumptions for using Pearson correlation are violated.
While Pearson correlation might be more commonly used, Spearman correlation has unique strengths and application areas in data analysis.
Recommended Related Articles
Remember to check out other relevant articles on our blog for more insights into statistical data analysis techniques!
- Coefficient of Determination vs. Coefficient of Correlation
- A Comprehensive Guide to Hypotheses Tests in Statistics
- Correlation vs. Causation: Understanding the Difference
- What’s Regression Analysis? A Comprehensive Guide
- Can the Correlation Coefficient Be Negative?
- Correlation in Statistics (Story)
- Kendall Tau-b vs Spearman (Story)
- Spearman Correlation – an overview (External Link)
- How to Report Pearson Correlation Results in APA Style
- Kendall Tau-b vs Spearman: Which Correlation Coefficient Wins?
- Correlation in Statistics: Understanding the Link Between Variables
Frequently Asked Questions (FAQs)
It’s used to measure the strength and direction of the monotonic relationship between two ranked variables, which is particularly useful with ordinal data.
The choice depends on your data and research questions. Pearson suits normally distributed and linear data, while Spearman is better for non-linear or ordinal data.
Spearman’s Rank Correlation is suitable for ordinal or continuous data that violates the assumptions of Pearson’s correlation.
Pearson might be more appropriate if data is normally distributed and has a linear relationship. Still, it doesn’t make it universally better.
The three types of correlation coefficients commonly used are Pearson, Spearman, and Kendall Tau.
Yes, it can range from -1 to +1; a negative value indicates a strong negative correlation.
Correlation measures the relationship between variables, while causality implies one variable is the cause of change in another.
The primary assumption is that the variables being tested are ordinal, interval, or ratio; it doesn’t require normal distribution like Pearson’s correlation.
It is computed based on the ranks of data rather than the actual raw data values.
No, it’s most suitable for ordinal (ranked) data, not categorical data.