Ice Cream and Polio: Understanding Correlation vs Causation
You Will Learn How Critical Thinking in Statistics Can Prevent Misguided Health Policies
Introduction
As the sun shone brighter and the days grew longer in the summer of the late 1940s, an unexpected and worrisome trend emerged in the United States. Public health officials observed a startling increase in polio cases, coinciding with the rise in ice cream sales. This observation sparked widespread concern, leading some to conjecture a direct link between the consumption of this cold treat and the occurrence of the disease. This historical episode serves as a poignant example of why distinguishing between correlation and causation is not only pivotal in the field of statistics but is also essential in formulating public health policies.
Understanding the difference between correlation and causation is fundamental to critical thinking in statistics. Correlation refers to a relationship where two or more variables move together. Yet, this movement does not imply that one variable causes the other to occur. Causation, however, suggests that one event directly results from another. As we explore the case of ice cream sales and polio incidence, we underscore the importance of this distinction. It is a distinction that, when overlooked, can lead to misguided health policies based on erroneous interpretations of data.
By dissecting this historical misunderstanding, we’ll see how critical analysis and statistical literacy can steer us away from such pitfalls. This article aims to illuminate the nuanced dynamics between correlated events and to champion the rigorous analysis that should underpin public health responses. Through this lens, we’ll appreciate the intricate dance of variables and learn how to discern authentic causative relationships from mere statistical shadows.
Highlights
- Historical Misinterpretation: In the 1940s, ice cream was wrongly blamed for polio.
- Correlation Defined: Correlation measures the strength of a relationship between two variables.
- Causation Established: Causation implies one event is the result of the occurrence of the other.
- Critical Tools: Regression analysis helps differentiate correlation from causation.
- Case Analysis: A statistical review of polio rates and ice cream sales reveals a correlation.
Ad Title
Ad description. Lorem ipsum dolor sit amet, consectetur adipiscing elit.
Historical Context
The 1940s were marked by a heightened sense of vulnerability concerning public health, mainly due to the polio epidemic that swept across the United States. Poliomyelitis, commonly known as polio, is a crippling and potentially deadly infectious disease caused by the poliovirus. It spread rapidly among children, especially during the summer months, causing widespread panic among parents and public health officials alike.
The surge in polio cases followed a seasonal pattern, peaking during the warmest months. This seasonal trend coincided with increased ice cream consumption, a favorite summertime treat. The concurrent rise of these two variables led to a public perception that perhaps ice cream consumption was facilitating the spread of polio. The ice cream theory was born out of this temporal association. It was bolstered by the fact that polio outbreaks seemed to escalate as ice cream sales soared.
This perception was so strong that there were instances where public health campaigns tentatively recommended the reduction or elimination of ice cream from children’s diets in the hope of curbing the disease’s spread. This theory exemplifies the pitfalls of conflating correlation with causation without sufficient scientific evidence. The true cause of polio’s spread was not ice cream but the poliovirus itself, which found a conducive environment for transmission in the summer.
This historical example is a cautionary tale of how correlation — a statistical relationship between two variables — can be mistakenly interpreted as causation without a thorough investigation and understanding of the underlying factors at play. It underscores the need for critical data evaluation before drawing conclusions that could lead to misguided actions.
Correlation Explained
The term “correlation” is one of the most widely used yet frequently misunderstood statistics concepts. It refers to a statistical measure gauges the extent and direction of the linear relationship between two quantitative variables. Correlation can indicate the strength and direction of a relationship, where the values of one variable predictably change with the other. However, it’s crucial to understand that correlation does not imply that changes in one variable cause changes in the other.
There are different types of correlations, primarily distinguished by the direction and strength of the relationship. The Pearson correlation coefficient, denoted as ‘r,’ measures the strength and direction of the linear relationship between two variables on a scale of -1 to +1. An ‘r’ value closer to +1 indicates a strong positive linear relationship, where the increase in one variable correlates with an increase in the other. Conversely, an ‘r’ value closer to -1 signifies a strong negative linear relationship, where an increase in one variable correlates with a decrease in the other. A zero correlation, where ‘r’ is around 0, suggests no linear relationship between the variables.
Apart from Pearson’s, other correlation coefficients are suited for different data types and distributions, such as Spearman’s rank correlation for ordinal data and Kendall’s tau. These non-parametric correlations are used when the data do not meet the assumptions necessary for Pearson’s correlation.
Understanding correlation is imperative because it can inform us about potential relationships that warrant further study. However, without additional analysis, we cannot conclude that a relationship involves causation. We cannot say that one variable’s movement is the reason for the other’s. This distinction is crucial in research and data analysis, as misinterpreting correlation for causation can lead to faulty conclusions and, potentially, erroneous decision-making.
Causation Elucidated
In contrast to correlation, causation in statistics is the concept that an event, behavior, or action directly produces an effect. Establishing causation means demonstrating that changes in one variable bring about changes in another. This connection goes beyond mere association; it involves a cause-and-effect relationship that can be reliably predicted and replicated under controlled conditions.
Causation is often established through experimentation, where researchers manipulate one variable (the independent variable) to observe the effect on another (the dependent variable) while controlling for external influences. This is the gold standard for establishing a causal link and is frequently used in scientific research, including clinical trials for new medications or interventions.
In observational studies, where controlled experiments are not feasible, statisticians rely on various methods to infer causation. One such method is regression analysis, which controls for various confounding factors that could influence the results. This statistical tool enables researchers to isolate the relationship between variables and make more robust inferences about causality.
However, establishing causation in statistics is not without its challenges. It requires a rigorous approach, including the satisfaction of several criteria: temporal precedence, where the cause precedes the effect; consistency across different studies; and the elimination of plausible alternative explanations. Only when these conditions are met can a claim of causation be substantiated confidently.
The quest to establish causation demands a thorough and systematic approach to ensure that conclusions drawn from statistical analyses are persuasive and accurate. This rigorous pursuit of causative relationships advances our understanding. It allows for informed decision-making, particularly in fields that rely heavily on data-driven evidence, such as public health, economics, and social sciences.
Ad Title
Ad description. Lorem ipsum dolor sit amet, consectetur adipiscing elit.
Correlation vs Causation in Health Science
The distinction between correlation and causation is particularly critical in health science, where understanding the relationship between variables can mean the difference between life and death. For instance, consider the long-held belief that high cholesterol levels are correlated with heart disease. This has led to widespread recommendations for low-fat diets. However, emerging research has begun to unravel the nuances of this relationship, suggesting that the type of fat consumed may be more important than the quantity.
Another well-known health-related example is the supposed link between vaccinations and autism. Despite extensive studies showing no causal link, the correlation observed in some data has led to vaccination hesitancy, which poses a significant public health risk.
The consequences of misinterpreting correlation as causation in health science can be severe. Policies based on incorrect assumptions can lead to ineffective treatment guidelines, unnecessary public fear, and the misallocation of resources. For instance, if a drug is correlated with a decreased risk of disease but does not causally reduce the risk, patients might be exposed to unnecessary side effects without any real benefit.
To prevent such misinterpretations, health scientists employ various tools and methodologies to test hypotheses about causation. These include randomized controlled trials, considered the gold standard for establishing causality in clinical research. Observational data is often scrutinized with advanced statistical models, such as Cox proportional hazards models or logistic regression, to control for confounding variables and better infer causal relationships.
Furthermore, longitudinal studies can provide valuable insights into causation by tracking changes over time and thus establishing a temporal sequence, which is necessary for causality. Meta-analyses and systematic reviews also contribute by aggregating data from multiple studies to assess the consistency of observed relationships, helping to confirm or refute potential causal links.
In summary, while the health science field frequently encounters correlations in data, researchers can establish causation only through careful and rigorous analysis. As we explore the intricate relationships between various health factors, we must approach each potential link with skepticism and open-mindedness, ensuring that policies and practices are grounded in solid, causal evidence rather than statistical associations.
Statistical Tools to Differentiate
The tools designed to differentiate between correlation and causation are indispensable in statistical analysis. One of the most potent tools is regression analysis. This statistical method models the relationship between a dependent variable and one or more independent variables. This technique is pivotal in determining the strength and character of the association between variables and whether any can be deemed causal.
Regression analysis can take many forms, including linear regression for modeling linear relationships, logistic regression for binary outcomes, and Cox regression for time-to-event data. Each type allows researchers to control for various confounding factors — variables that could falsely appear to be the cause of an outcome. By adjusting for these confounders, statisticians can isolate the effect of the independent variable on the dependent variable and make more accurate inferences about causality.
The capacity of regression analysis to provide insights into causation is augmented by its ability to handle complex models, including those with interaction terms, non-linear relationships, and multiple independent variables. Regression can help predict outcomes and inform decision-making processes by establishing probable causes when used correctly.
However, it is crucial to note that regression analysis alone cannot prove causation; it can only suggest that a causal relationship may exist. To confirm causation, researchers must conduct randomized controlled experiments where participants are randomly assigned to different treatment groups to ensure that any observed effects are due to the treatment and not other variables.
Another critical tool in the statistician’s arsenal is using instrumental variables, which can help identify causal relationships by using a third variable that affects the independent variable but is not directly associated with the dependent variable. This method helps to mitigate the effects of omitted variable bias, a common issue in observational studies.
Path analysis and structural equation modeling (SEM) are other sophisticated statistical methods to understand the direct and indirect relationship between variables. These methods are instrumental in situations where variables influence each other in complex ways, often in the social sciences.
In summary, while statistical tools cannot establish causation definitively without experimental evidence, they are essential in guiding researchers toward causal hypotheses. When applied meticulously and in conjunction with robust experimental designs, these tools strengthen the validity of causal inferences, thus enhancing the quality and reliability of scientific research.
Case Study: Ice Cream Sales and Polio Rates
The narrative of ice cream sales being linked to polio rates in the 1940s provides a fertile ground for examining the principles of correlation and causation. This historical case study offers an opportunity to apply statistical analysis to understand the relationship between these two variables.
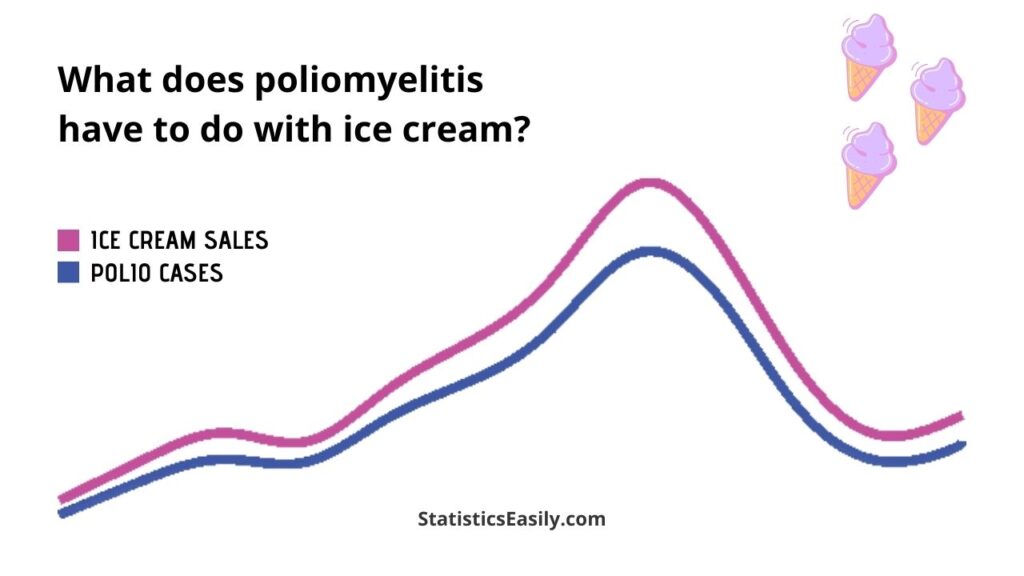
Statistical data depicted a significant rise in polio cases during summer, coincidentally the peak season for ice cream sales. Public health officials were concerned about this apparent association at the time. They pondered the potential risks ice cream might pose in the spread of polio. The first step in a statistical analysis of this case would involve plotting the data for polio incidence and ice cream sales over time to inspect the correlation visually.
To investigate this relationship further, a Pearson correlation coefficient could be calculated to quantify the strength and direction of the linear relationship between ice cream sales and polio cases. If a high correlation coefficient was found, this would indicate a strong relationship between the two variables. However, it is imperative to remember that this correlation does not imply causation.
To delve deeper, a regression analysis could be employed, using polio rates as the dependent variable and ice cream sales as the independent variable while controlling for other variables such as weather conditions, population density, and public sanitation practices that could affect polio transmission. This would help to isolate the effect of ice cream sales on polio rates and determine if there is any causative effect.
Additionally, time-series analysis would be beneficial in this case study to understand the patterns and trends over time, considering that seasonal factors influence ice cream sales and polio cases. This analysis could help determine if the rise in polio cases preceded the increase in ice cream sales or vice versa, aiding in establishing temporal precedence, a necessary criterion for causation.
One could also examine the data using methods for interrupted time-series analysis, where public health interventions, such as polio vaccination campaigns, are considered. This would provide insight into whether changes in polio rates could be attributed to these interventions rather than ice cream consumption.
In conclusion, this case study exemplifies the importance of using statistical tools to distinguish between correlation and causation. The misinterpretation that ice cream consumption led to polio was debunked through careful statistical analysis, revealing that the poliovirus’s transmission was unrelated to ice cream. Instead, both were correlated due to the seasonal nature of polio outbreaks and ice cream consumption. Such analyses underscore the necessity of rigorous statistical evaluation to inform public health policies and prevent the spread of misinformation.
Ad Title
Ad description. Lorem ipsum dolor sit amet, consectetur adipiscing elit.
Conclusion
In retrospect, the tale of ice cream sales purportedly influencing polio rates stands as a historical beacon, illuminating the critical importance of differentiating between correlation and causation. This narrative, ingrained in the annals of public health, reminds us that statistical associations alone are not indicative of causative forces at work.
The key insights drawn from our exploration of this topic affirm that while correlation can signal a possible connection worth investigating, it is insufficient evidence to establish a cause-and-effect relationship. The polio and ice cream sales case study is a testament to the myriad factors that can contribute to health-related phenomena and the danger of drawing hasty conclusions without rigorous statistical scrutiny.
As we dissected the statistical relationship between these two variables, we underscored the value of critical tools like regression and time-series analysis in dissecting data and revealing the underlying truths. When applied with methodological rigor, such tools can help distinguish mere coincidences from accurate causal links.
This investigation also highlighted the importance of critical thinking in statistical analysis. It is a cognitive bulwark against the pitfalls of misinterpretation and the propagation of myths. Critical thinking empowers us to question assumptions, scrutinize data, and demand robust evidence for claims of causality. It encourages a healthy skepticism foundational to scientific inquiry and informed policy-making.
In conclusion, as we navigate a world increasingly driven by data, the lessons learned from examining the correlation between ice cream sales and polio rates remain ever-relevant. They serve as a clarion call for the prudent interpretation of statistical data, emphasizing the indispensable need for critical thinking to discern the true nature of the relationships within. Through this lens of analytical rigor, we can aspire to craft policies and interventions that are not only based on evidence but are also genuinely effective in improving public health and welfare.
Recommended Articles
Are you interested in more statistical insights? Dive into our collection of articles on statistical myths and truths that shape our understanding of data.
- 5 Statistics Case Studies That Will Blow Your Mind
- Music, Tea, and P-Values: A Tale of P-Hacking
- Fallacies Influenced the Perception of the Mozart Effect
- Correlation vs Causation: Understanding the Difference
- Correlation in Statistics: The Link Between Variables
Frequently Asked Questions (FAQs)
Q1: What is Correlation? Correlation is a statistical measure that expresses the extent to which two variables are linearly related.
Q2: What is Causation? Causation indicates that one event results from the occurrence of the other; there is a cause-and-effect relationship.
Q3: How Can We Distinguish Between Correlation and Causation? We can distinguish between correlation and causation by conducting controlled experiments and regression analysis to identify causal relationships.
Q4: Why is the Distinction Between Correlation and Causation Important? Understanding this distinction is crucial in scientific research to avoid incorrect conclusions leading to ineffective or harmful actions.
Q5: Can Correlation Indicate Causation? While correlation can suggest a potential cause-and-effect relationship, it does not prove it.
Q6: What are Common Misconceptions About Correlation and Causation? A common misconception is that if two variables correlate, one must cause the other, which is not necessarily true.
Q7: How did the Ice Cream and Polio Myth Begin? The myth began when polio rates and ice cream sales increased during summer, leading to an incorrect assumption of causation.
Q8: What are Some Tools Used to Test Causation? Tools like randomized controlled trials and multiple regression analysis are used to test for causation.
Q9: How Does Confounding Affect Correlation? Confounding occurs when an outside factor affects both variables of interest, giving the illusion of a cause-and-effect relationship.
Q10: What Role Does Critical Thinking Play in Statistical Analysis? Critical thinking allows statisticians to question correlations and investigate further before concluding a causative relationship.