
Non-Parametric Statistics: A Comprehensive Guide
Exploring the Versatile World of Non-Parametric Statistics: Mastering Flexible Data Analysis Techniques.
Introduction
Non-parametric statistics serve as a critical toolset in data analysis. They are known for their adaptability and the capacity to provide valid results without the stringent prerequisites demanded by parametric counterparts. This article delves into the fundamentals of non-parametric techniques, shedding light on their operational mechanisms, advantages, and scenarios of optimal application. By equipping readers with a solid grasp of non-parametric statistics, we aim to enhance their analytical capabilities, enabling the effective handling of diverse datasets, especially those that challenge conventional parametric assumptions. Through a precise, technical exposition, this guide seeks to elevate the reader’s proficiency in applying non-parametric methods to extract meaningful insights from data, irrespective of its distribution or scale.
Highlights
- Non-parametric statistics bypass assumptions for true data integrity.
- Flexible methods in non-parametric statistics reveal hidden data patterns.
- Real-world applications of non-parametric statistics solve complex issues.
- Non-parametric techniques like Mann-Whitney U bring clarity to data.
- Ethical data analysis through non-parametric statistics upholds truth.
Ad Title
Ad description. Lorem ipsum dolor sit amet, consectetur adipiscing elit.
Understanding Non-Parametric Statistics
Non-parametric statistics are indispensable in data analysis, mainly due to their capacity to process data without the necessity for predefined distribution assumptions. This distinct attribute sets non-parametric methods apart from parametric ones, which mandate that data adhere to certain distribution norms, such as the normal distribution. The utility of non-parametric techniques becomes especially pronounced with datasets where the distribution is either unknown, non-normal, or insufficient sample size to validate any distributional assumptions.
The cornerstone of non-parametric statistics is their reliance on the ranks or order of data points instead of the actual data values. This approach renders them inherently resilient to outliers and aptly suited for analyzing non-linear relationships within the data. Such versatility makes non-parametric methods applicable across diverse data types and research contexts, including situations involving ordinal data or instances where scale measurements are infeasible.
By circumventing the assumption of a specific underlying distribution, non-parametric methods facilitate a more authentic data analysis, capturing its intrinsic structure and characteristics. This capability allows researchers to derive conclusions that are more aligned with the actual nature of their data, which is particularly beneficial in disciplines where data may not conform to the conventional assumptions underpinning parametric tests.
Non-Parametric Statistics Flexibility
The core advantage of Non-Parametric Statistics lies in its inherent flexibility, which is crucial for analyzing data that doesn’t conform to the assumptions required by traditional parametric methods. This flexibility stems from the ability of non-parametric techniques to make fewer assumptions about the data distribution, allowing for a broader application across various types of data structures and distributions.
For instance, non-parametric methods do not assume a specific underlying distribution (such as normal distribution), making them particularly useful for skewed, outliers, or ordinal data. This is a significant technical benefit when dealing with real-world data, often deviating from idealized statistical assumptions.
Moreover, non-parametric statistics are adept at handling small sample sizes where the central limit theorem might not apply, and parametric tests could be unreliable. This makes them invaluable in fields where large samples are difficult to obtain, such as in rare disease research or highly specialized scientific studies.
Another technical aspect of non-parametric methods is their use in hypothesis testing, particularly with the Wilcoxon Signed-Rank Test for paired data and the Mann-Whitney U Test for independent samples. These tests are robust alternatives to the t-test when the data does not meet the necessary parametric assumptions, providing a means to conduct meaningful statistical analysis without the stringent requirements of normality and homoscedasticity.
The flexibility of non-parametric methods extends to their application in correlation analysis with Spearman’s rank correlation and in estimating distribution functions with the Kaplan-Meier estimator, among others. These tools are indispensable in fields ranging from medical research to environmental studies, where the nature of the data and the research questions do not fit neatly into parametric frameworks.
Techniques and Methods
In non-parametric statistics, several essential techniques and methods stand out for their utility and versatility across various types of data analysis. This section delves into six standard non-parametric tests, providing a technical overview of each method and its application.
Mann-Whitney U Test: Often employed as an alternative to the t-test for independent samples, the Mann-Whitney U test is pivotal when comparing two independent groups. It assesses whether their distributions differ significantly, relying not on the actual data values but on the ranks of these values. This test is instrumental when the data doesn’t meet the normality assumption required by parametric tests.
Wilcoxon Signed-Rank Test: This test is a non-parametric alternative to the paired t-test, used when assessing the differences between two related samples, matched samples, or repeated measurements on a single sample. The Wilcoxon test evaluates whether the median differences between pairs of observations are zero. It is ideal for the paired differences that do not follow a normal distribution.
Kruskal-Wallis Test: As the non-parametric counterpart to the one-way ANOVA, the Kruskal-Wallis test extends the Mann-Whitney U test to more than two independent groups. It evaluates whether the populations from which the samples are drawn have identical distributions. Like the Mann-Whitney U, it bases its analysis on the rank of the data, making it suitable for data that does not follow a normal distribution.
Friedman Test: Analogous to the repeated measures ANOVA in parametric statistics, the Friedman test is a non-parametric method for detecting differences in treatments across multiple test attempts. It is beneficial for analyzing data from experiments where measurements are taken from the same subjects under different conditions, allowing for assessing the effects of other treatments on a single sample population.
Spearman’s Rank Correlation: Spearman’s rank correlation coefficient offers a non-parametric measure of the strength and direction of association between two variables. It is especially applicable in scenarios where the variables are measured on an ordinal scale or when the relationship between variables is not linear. This method emphasizes the monotonic relationship between variables, providing insights into the data’s behavior beyond linear correlations.
Kendall’s Tau: Kendall’s Tau is a correlation measure designed to assess the association between two measured quantities. It determines the strength and direction of the relationship, much like Spearman’s rank correlation, but focuses on the concordance and discordance between data points. Kendall’s Tau is particularly useful for data that involves ordinal or ranked variables, providing insight into the monotonic relationship without assuming linearity.
Chi-square Test: The Chi-square test is a non-parametric statistical tool used to determine whether there is a significant difference between the expected frequencies and the observed frequencies in one or more categories. It is beneficial in categorical data analysis, where the variables are nominal or ordinal, and the data are in the form of frequencies or counts. This test is valuable when evaluating hypotheses on the independence of two variables or the goodness of fit for a particular distribution.
Non-Parametric Statistics Real-World Applications
The practical utility of Non-Parametric Statistics is vast and varied, spanning numerous fields and research disciplines. This section showcases real-world case studies and examples where non-parametric methods have provided insightful solutions to complex problems, highlighting the depth and versatility of these techniques.
Environmental Science: In a study examining the impact of industrial pollution on river water quality, researchers employed the Kruskal-Wallis test to compare the pH levels across multiple sites. This non-parametric method was chosen due to the non-normal distribution of pH levels and the presence of outliers caused by sporadic pollution events. The test revealed significant differences in water quality, guiding policymakers in identifying pollution hotspots.
Medical Research: In a longitudinal study on chronic pain management, the Wilcoxon Signed-Rank Test was employed to assess the effectiveness of a novel therapy compared to conventional treatment. Each patient underwent both treatments in different periods, with pain scores recorded on an ordinal scale before and after each treatment phase. Given the non-normal distribution of differences in pain scores before and after each treatment for the same patient, the Wilcoxon test facilitated a statistically robust analysis. It revealed a significant reduction in pain intensity with the new therapy compared to conventional treatment, thereby demonstrating its superior efficacy in a manner that was both robust and suited to the paired nature of the data.
Market Research: A market research firm used Spearman’s Rank Correlation to analyze survey data to understand customer satisfaction across various service sectors. The ordinal ranking of satisfaction levels and the non-linear relationship between service features and customer satisfaction made Spearman’s correlation an ideal choice, uncovering critical drivers of customer loyalty.
Education: In educational research, the Friedman test was utilized to assess the effectiveness of different teaching methods on student performance over time. With data collected from the same group of students under three distinct teaching conditions, the test provided insights into which method led to significant improvements, informing curriculum development.
Social Sciences: Kendall’s Tau was applied in a sociological study to examine the relationship between social media usage and community engagement among youths. Given the ordinal data and the interest in understanding the direction and strength of the association without assuming linearity, Kendall’s Tau offered nuanced insights, revealing a weak but significant negative correlation.

Non-Parametric Statistics Implementation in R
Implementing non-parametric statistical methods in R involves a systematic approach to ensure accurate and ethical analysis. This step-by-step guide will walk you through the process, from data preparation to result interpretation, while emphasizing the importance of data integrity and ethical considerations.
1. Data Preparation:
- Begin by importing your dataset into R using functions like read.csv() for CSV files or read.table() for tab-delimited data.
- Perform initial data exploration using functions like summary(), str(), and head() to understand your data’s structure, variables, and any apparent issues like missing values or outliers.
2. Choosing the Right Test:
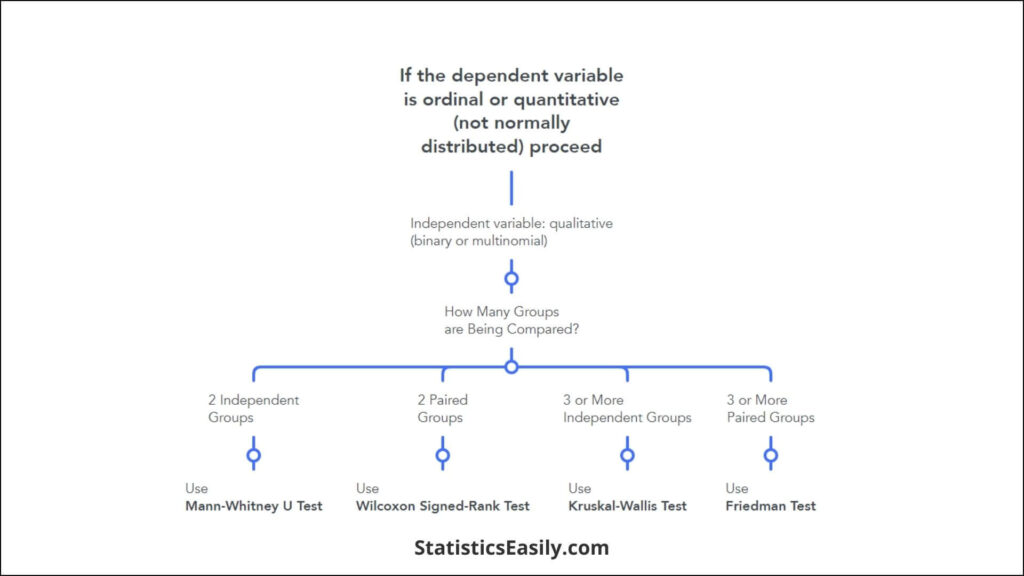
- Determine the appropriate non-parametric test based on your data type and research question. For two independent samples, consider the Mann-Whitney U test (wilcox.test() function); for paired samples, use the Wilcoxon Signed-Rank test (wilcox.test() with paired = TRUE); for more than two independent groups, use the Kruskal-Wallis test (kruskal.test()); and for correlation analysis, use Spearman’s rank correlation (cor.test() with method = “spearman”).
3. Executing the Test:
- Execute the chosen test using its corresponding function. Ensure your data meets the test’s requirements, such as correctly ranked or categorized.
- For example, to run a Mann-Whitney U test, use wilcox.test(group1, group2), replacing group1 and group2 with your actual data vectors.
4. Result Interpretation:
- Carefully interpret the output, paying attention to the test statistic and p-value. A p-value less than your significance level (commonly 0.05) indicates a statistically significant difference or correlation.
- Consider the effect size and confidence intervals to assess the practical significance of your findings.
5. Data Integrity and Ethical Considerations:
- Ensure data integrity by double-checking data entry, handling missing values appropriately, and conducting outlier analysis.
- Maintain ethical standards by respecting participant confidentiality, obtaining necessary permissions for data use, and reporting findings honestly without data manipulation.
6. Reporting:
- When documenting your analysis, include a detailed methodology section that outlines the non-parametric tests used, reasons for their selection, and any data preprocessing steps.
- Present your results using visual aids like plots or tables where applicable, and discuss the implications of your findings in the context of your research question.
Ad Title
Ad description. Lorem ipsum dolor sit amet, consectetur adipiscing elit.
Conclusion
Throughout this article, we have underscored the significance and value of non-parametric statistics in data analysis. These methods enable us to approach data sets with unknown or non-normal distributions, providing genuine insights and unveiling the truth and beauty hidden within the data. We encourage readers to maintain an open mind and a steadfast commitment to uncovering authentic insights when applying statistical methods to their research and projects. We invite you to explore the potential of non-parametric statistics in your endeavors and to share your findings with the scientific and academic community, contributing to the collective enrichment of knowledge and the advancement of science.
Recommended Articles
Discover more about the transformative power of data analysis in our collection of articles. Dive deeper into the world of statistics with our curated content and join our community of truth-seeking analysts.
- Understanding the Assumptions for Chi-Square Test of Independence
- What is the difference between t-test and Mann-Whitney test?
- Mastering the Mann-Whitney U Test: A Comprehensive Guide
- A Comprehensive Guide to Hypotheses Tests in Statistics
- A Guide to Hypotheses Tests
Frequently Asked Questions (FAQs)
Q1: What Are Non-Parametric Statistics? Non-parametric statistics are methods that don’t rely on data from specific distributions. They are used when data doesn’t meet the assumptions of parametric tests.
Q2: Why Choose Non-Parametric Methods? They offer flexibility in analyzing data with unknown distributions or small sample sizes, providing a more ethical approach to data analysis.
Q3: What Is the Mann-Whitney U Test? It’s a non-parametric test for assessing whether two independent samples come from the same distribution, especially useful when data doesn’t meet normality assumptions.
Q4: How Do Non-Parametric Methods Enhance Data Integrity? By not imposing strict assumptions on data, non-parametric methods respect the natural form of data, leading to more truthful insights.
Q5: Can Non-Parametric Statistics Handle Outliers? Yes, non-parametric statistics are less sensitive to outliers, making them suitable for datasets with extreme values.
Q6: What Is the Kruskal-Wallis Test? This test is a non-parametric method for comparing more than two independent samples, proper when the ANOVA assumptions are not met.
Q7: How Does Spearman’s Rank Correlation Work? Spearman’s rank correlation measures the strength and direction of association between two ranked variables, ideal for non-linear relationships.
Q8: What Are the Real-World Applications of Non-Parametric Statistics? They are widely used in fields like environmental science, education, and medicine, where data may not follow standard distributions.
Q9: What Are the Benefits of Using Non-Parametric Statistics in Data Analysis? They provide a more inclusive data analysis, accommodating various data types and distributions and revealing deeper insights.
Q10: How to Get Started with Non-Parametric Statistical Analysis? Begin by understanding the nature of your data and choosing appropriate non-parametric methods that align with your analysis goals.