
Random Forest in Practice: An Essential Guide
You will learn how Random Forest leverages decision trees to improve predictive accuracy in complex datasets.
Introduction
Random Forest is an essential machine learning algorithm that has gained widespread popularity in data science due to its effectiveness in handling classification and regression tasks. At the core of its success is the ability to construct multiple decision trees during the training process and output the mode of the classes (classification) or mean prediction (regression) of the individual trees. This introductory guide is designed to demystify Random Forests for beginners by providing a clear, step-by-step explanation of how it works, alongside a practical guide to implementing it in Python. Our objective is to equip readers with the knowledge to understand the theoretical underpinnings of Random Forest and apply it effectively in their data science projects, leveraging Python’s powerful programming capabilities.
Highlights
- Random Forest outperforms single decision trees by reducing overfitting.
- Hyperparameter tuning in Random Forest crucially enhances model accuracy.
- Data preprocessing is pivotal for Random Forest’s predictive success.
- Step-by-step Python guide simplifies Random Forest implementation.
- Evaluating Random Forest models involves accuracy, precision, and recall metrics.
Ad Title
Ad description. Lorem ipsum dolor sit amet, consectetur adipiscing elit.
Understanding Random Forest
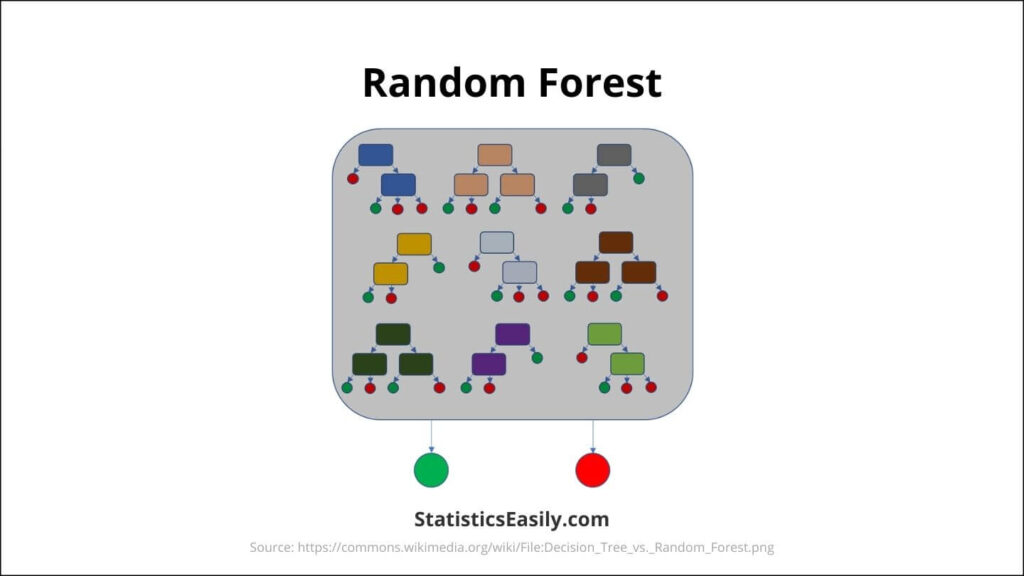
Random Forest is a machine learning algorithm that builds on the concept of decision trees to provide a more accurate and robust predictive model. It creates many decision trees during training. It outputs the class, that is, the mode of the classes (in classification) or mean prediction (in regression) of the individual trees.
How Random Forest Works:
Decision Trees: Random Forest starts with decision trees, which are simple, tree-like decision-making models. Each tree in a Random Forest gives a prediction, and the algorithm takes the majority vote or average in case of regression as the final output.
Bootstrapping: This technique randomly selects a subset of the data set for each tree, ensuring diversity among the trees and contributing to the model’s robustness.
Aggregation (Bagging): The algorithm then aggregates the individual trees’ predictions to produce a more accurate and stable prediction.
Advantages of Random Forest:
Reduced Overfitting: Unlike individual decision trees that often suffer from overfitting to their training data, Random Forest mitigates this risk through its ensemble approach. Averaging the predictions from numerous trees ensures that the model’s overall prediction is not overly dependent on any single portion of the training data, leading to more generalizable results.
High Accuracy: Random Forest’s strength lies in its aggregation of predictions from multiple decision trees, each trained on different subsets of the same data. This ensemble method significantly boosts prediction accuracy, outperforming many single-model approaches across various datasets and problem types.
Versatility in Application: Random Forest’s design allows it to excel across various tasks, from predicting categorical outcomes in classification problems to estimating continuous variables in regression analyses. Its robust handling of datasets with missing values and its ability to process numerical and categorical data without extensive preprocessing make it exceptionally flexible.
Insights into Feature Importance: One of the standout capabilities of Random Forest is its inherent feature selection mechanism. By analyzing the impact of each feature on the prediction accuracy across all trees, Random Forest can rank the importance of features within the dataset. This insight is invaluable for understanding the driving factors behind predictions. It can guide feature selection in model refinement and data analysis processes.
Applications of Random Forest:
Finance: Random Forest is extensively used in the financial sector for critical tasks such as evaluating credit risk by analyzing credit scores and forecasting future movements in the stock market, aiding investment strategies.
E-commerce: This algorithm enhances online shopping experiences by powering recommendation systems that suggest products based on user behavior and preferences. It also plays a pivotal role in segmenting customers into distinct groups for targeted marketing and promotional strategies.
Healthcare: In the medical field, Random Forest contributes to early disease detection by analyzing patient data for symptoms indicative of specific conditions. It also helps categorize patients into risk groups, facilitating personalized treatment plans.
Cyber Security: Given the increasing sophistication of cyber threats, Random Forest aids in the timely detection and prediction of potential fraud and security breaches, leveraging anomaly detection in data patterns to safeguard digital assets.
Random Forest Theoretical Foundations
Random Forest algorithm operates on the principle of ensemble learning, where multiple classifiers, in this case, decision trees, are combined to solve a complex problem and improve the model’s performance.
Detailed Explanation of the Algorithm:
Ensemble of Decision Trees: Random Forest creates a forest of uncorrelated decision trees, each trained on the training data’s random subsets, using a bootstrapping technique.
Random Feature Selection: Each tree chooses a random feature subset at every split. This randomness helps make the trees more diverse, increasing the overall model’s accuracy.
Aggregation: The final prediction of the Random Forest is determined by aggregating the predictions of individual trees. This aggregation reduces the variance, controls overfitting, and improves the model’s predictive accuracy.
Hyperparameters and Their Impact:
Number of Trees (n_estimators): Increasing the number of trees generally improves model performance but increases computational cost.
Maximum Depth (max_depth): Controls the depth of each tree. Deeper trees can capture more complex patterns but may lead to overfitting.
Minimum Samples Split (min_samples_split): Determines the minimum number of samples required to split an internal node. Higher values prevent the model from learning too specific patterns.
Maximum Features (max_features): The size of the random subsets of features to consider when splitting a node. It influences the diversity of trees in the forest.
Measuring the Effectiveness:
Accuracy: The proportion of correctly predicted observations to the total observations. It’s a valuable metric for balanced classification problems.
Confusion Matrix: A detailed breakdown of the model’s performance, including true positives, true negatives, false positives, and false negatives.
Precision, Recall, and F1 Score: Precision is the ratio of correctly predicted positive observations to the total predicted positives. Recall (sensitivity) measures the ratio of correctly predicted positive observations to all observations in the actual class. The F1 Score is the weighted average of Precision and Recall. These metrics are critical in the context of imbalanced datasets.
Preparing Your Data
Effective data preprocessing is a crucial step in machine learning that significantly impacts the performance of models like Random Forest. This section outlines the essential data cleaning and preparation steps, ensuring the data is optimally structured for Random Forests modeling.
Importance of Data Preprocessing:
Data preprocessing transforms raw data into a clean dataset that can be used directly for machine learning models. This process is vital because it directly influences the model’s ability to learn and make accurate predictions. For Random Forest, where multiple decision trees are involved, preprocessing ensures consistency and quality across the dataset, allowing the algorithm to identify patterns more effectively.
Steps for Data Cleaning and Preparation:
1. Handling Missing Values: Random Forest can handle missing values to some extent. However, it’s generally best practice to impute missing values using strategies like mean imputation for numerical features and mode imputation for categorical features.
2. Encoding Categorical Variables: Convert categorical variables into numerical format through encoding techniques such as one-hot or label encoding, as Random Forest cannot process raw textual data.
3. Feature Scaling: While Random Forest is not as sensitive to feature scaling as algorithms like SVM or KNN, ensuring all features are on the same scale can help improve model convergence and interpretability of feature importance scores.
4. Removing Irrelevant Features: Eliminate features that do not contribute to the prediction or might introduce noise. Although Random Forest selects features randomly during training, reducing dimensionality upfront can decrease training time and complexity.
Splitting the Dataset:
Training and Testing Sets: Divide your data into training and testing sets to evaluate the model’s performance on unseen data. A typical split ratio is 70:30 or 80:20, where the more significant portion is used for training.
Cross-Validation: Consider using cross-validation techniques, especially k-fold cross-validation, to ensure that the model’s performance is consistent across different subsets of the data.
Random Forest Practical Application with Python
Applying Random Forest in Python effectively combines the algorithm’s theoretical understanding with practical coding skills. This section guides you through setting up your Python environment, implementing Random Forest using the sklearn library, and applying it to a real dataset.
A Practical Example: Predicting Iris Species
The Iris dataset contains 150 iris plants, classified into three species based on four features: sepal length, sepal width, petal length, and petal width. The Random Forest model learns from the training data and accurately predicts the species of iris plants.
Following the steps below, you can implement Random Forests in Python for various datasets, not just the Iris dataset. Adjust the model’s hyperparameters, such as n_estimators and max_depth, to improve performance based on your specific dataset and task.
The code snippets provided are designed to be straightforward to follow, with explanations for each step to facilitate understanding and implementation. This practical application demonstrates the power of Random Forests in predictive modeling. It provides a solid foundation for exploring more complex data science projects.

Setting Up Your Python Environment
To work with Random Forest in Python, ensure you have Python installed on your machine. Use the following packages:
- NumPy: For handling arrays and matrices.
- Pandas: For data manipulation and analysis.
- Scikit-learn (sklearn): Provides the Random Forest algorithm and additional functionality for building predictive models.
- Matplotlib/Seaborn: For visualizing data and model results.
Install these packages using pip:
pip install numpy pandas scikit-learn matplotlib seaborn
Implementing Random Forest with sklearn
The sklearn.ensemble module includes the RandomForestClassifier for classification tasks and RandomForestRegressor for regression tasks. Here’s a step-by-step guide to using RandomForestClassifier:
1. Import Necessary Libraries:
from sklearn.ensemble import RandomForestClassifier
from sklearn.model_selection import train_test_split
from sklearn.metrics import accuracy_score, confusion_matrix, classification_report
import pandas as pd
import matplotlib.pyplot as plt
import seaborn as sns
2. Load Your Dataset: We’ll use the Iris dataset, a classic in machine learning examples, for this example.
from sklearn.datasets import load_iris
iris = load_iris()
X = iris.data
y = iris.target
3. Split the Dataset: Split your data into training and testing sets to evaluate the model’s performance.
X_train, X_test, y_train, y_test = train_test_split(X, y, test_size=0.3, random_state=42)
4. Initialize and Train the Model: Create an instance of RandomForestClassifier and fit it to your training data.
clf = RandomForestClassifier(n_estimators=100, random_state=42)
clf.fit(X_train, y_train)
5. Make Predictions and Evaluate the Model: Use the trained model to predict the test set and evaluate the accuracy.
y_pred = clf.predict(X_test)
print(f"Accuracy: {accuracy_score(y_test, y_pred)}")
Model Results and Interpretation
After training the model and making predictions, it’s crucial to interpret the results to understand its performance and how it can be improved.
Evaluating Model Performance: First, examine the model’s accuracy, then explore more descriptive metrics.
# Model Accuracy
print(f"Model Accuracy: {accuracy_score(y_test, y_pred):.2f}")
Confusion Matrix: A confusion matrix provides insight into each class’s correct and incorrect predictions.
cm = confusion_matrix(y_test, y_pred)
sns.heatmap(cm, annot=True, fmt="d", cmap="viridis", xticklabels=iris.target_names, yticklabels=iris.target_names)
plt.xlabel('Predicted')
plt.ylabel('Actual')
plt.title('Confusion Matrix')
plt.show()
Classification Report: The classification report includes metrics such as precision, recall, and f1-score for each class.
print(classification_report(y_test, y_pred, target_names=iris.target_names))
Feature Importance: Understanding which features most significantly impact your model’s decisions can provide insights into the dataset.
feature_importance = clf.feature_importances_
sns.barplot(x=feature_importance, y=iris.feature_names)
plt.title('Feature Importance')
plt.show()
Model Interpretation
The accuracy score, confusion matrix, and classification report collectively offer a comprehensive view of the model’s performance. The high accuracy indicates the model’s effectiveness in classifying iris species, while the confusion matrix and classification report detail its precision, recall, and f1-scores across classes.
The feature importance plot reveals which characteristics of the iris flowers (like petal length or width) influence the model’s classification decisions. This insight is valuable for understanding the Random Forest model’s decision-making process and future feature engineering or selection endeavors.
By interpreting these results, we can conclude that the Random Forest classifier is highly effective for this dataset, providing a solid foundation for predictive modeling tasks. Experimenting with different datasets or adjusting hyperparameters could enhance the model’s performance or adaptability to various problems.
Interpreting Individual Decision Trees within Random Forest
While Random Forest is a collection of decision trees, each tree contributes to the outcome. Visualizing individual trees can provide insight into the decision-making process on a more granular level. Let’s examine one such tree from our Random Forest model:
Visualizing a Decision Tree from the Random Forest:
# Visualize the first decision tree from the Random Forest
tree_index = 0
plt.figure(figsize=(20,10))
plot_tree(clf.estimators_[tree_index],
          feature_names=iris.feature_names,
          class_names=iris.target_names,
          filled=True,
          rounded=True)
plt.title(f'Decision Tree Visualization: Tree {tree_index}')
plt.show()
This visualization showcases how a single decision tree within the Random Forest makes classifications. It starts at the top with a root node, then splits into branches and decision nodes based on feature values, and finally ends with leaf nodes representing the class predictions.
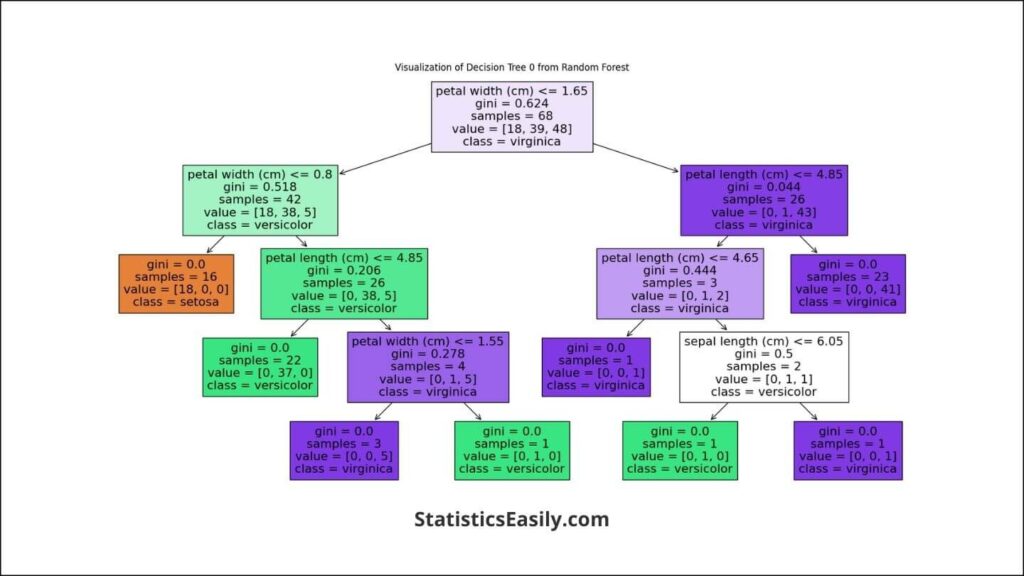
Analyzing the Tree Structure:
Each node in the tree represents a decision based on the value of a particular feature. For example, a node might split the data based on an iris flower’s petal length or width. The branches represent the outcome of that decision, leading to new decision nodes or leaf nodes. The leaf nodes provide the final class predictions when a set of criteria determined by the path from the root is met.
The depth and complexity of this tree indicate the model’s classification strategy. In practice, Random Forest combines the predictions from multiple such trees to make a final, more accurate classification, thereby leveraging the strengths of each tree while compensating for their weaknesses.
Including a decision tree visualization such as the one generated above can enrich your article by allowing readers to visualize the predictive process. It demystifies the model’s operation and provides a tangible example of how Random Forest leverages multiple decision paths to arrive at a classification decision.
Evaluating Your Model
After implementing the Random Forest model using Python, the next crucial step is evaluating its performance. This involves using specific metrics to understand how well the model predicts outcomes on new, unseen data. This section covers the critical evaluation metrics and offers model improvement and tuning tips.
How to Evaluate the Performance of Your Random Forest Model:
Evaluation metrics are essential to assess the accuracy and effectiveness of your Random Forest model. Here are the most commonly used metrics:
Accuracy: This is the most straightforward metric, calculated by the number of correct predictions divided by the total number of predictions. While useful, accuracy alone can be misleading, especially in datasets with imbalanced classes.
Precision and Recall: Precision (the proportion of true positive results in all positive predictions) and recall (the proportion of true positive results in all actual positives) are critical when the costs of false positives and false negatives are high, for instance, in medical diagnosis or fraud detection scenarios.
F1 Score: The F1 Score is the harmonic mean of precision and recall, providing a single metric to assess their balance. An F1 Score reaches its best value at 1 (perfect precision and recall) and worst at 0.
Confusion Matrix: A table used to describe the performance of a classification model on a set of test data for which the true values are known. It allows you to visualize the model’s predictions, including true positives, false positives, true negatives, and false negatives.
Interpreting the Results:
Understanding these metrics allows you to gauge the model’s performance accurately. For instance, a high accuracy rate might seem excellent at first glance. However, further inspection through precision, recall, and the F1 Score might reveal areas where the model struggles, such as failing to predict a particular class accurately.
Tips for Model Improvement and Tuning:
Hyperparameter Tuning: Random Forest models have several hyperparameters, such as the number of trees (n_estimators) and the depth of the trees (max_depth), which can significantly impact performance. Utilizing grid search or random search methods can help find the optimal combination of these hyperparameters for your specific dataset.
Feature Selection: Random Forests can inherently rank the importance of features. By analyzing and eliminating less critical features, you can reduce the model’s complexity and improve performance.
Cross-Validation: Implementing cross-validation, like k-fold cross-validation, helps ensure that your model’s performance is consistent across different subsets of your dataset, thereby increasing the robustness of your model.
Ad Title
Ad description. Lorem ipsum dolor sit amet, consectetur adipiscing elit.
Conclusion
This article has provided a comprehensive guide to understanding and applying Random Forest in Python, covering its theoretical foundations, data preparation, practical implementation, and model evaluation. With its ability to handle classification and regression tasks effectively, Random Forest remains a powerful tool in the data scientist’s arsenal, offering high accuracy and robustness against overfitting. The encouragement to experiment with different datasets and confront various predictive modeling problems underlines the versatility and adaptability of Random Forest. By following the detailed steps, from setting up the Python environment to evaluating the model’s performance, readers are well-equipped to leverage Random Forest in their data science projects, pushing the boundaries of predictive analytics.
Recommended Articles
Explore more insights and tutorials on Data Science topics by checking out our other articles.
- Decision Trees: From Theory to Practice in Python for Aspiring Data Scientists
- Understanding Random Sampling: Essential Techniques in Data Analysis
- Random Sampling on Excel: An In-depth Analysis
- Logistic Regression Using Scikit-Learn (Story)
- Generate a Random Number
Frequently Asked Questions (FAQs)
Q1: What is Random Forest? It’s a versatile machine learning method capable of performing regression and classification tasks, using multiple decision trees and averaging their predictions to improve accuracy and control over-fitting.
Q2: How does a Random Forest work? A Random Forest creates a ‘forest’ of random decision trees to make its predictions more accurate than any single decision tree by averaging the results or using majority voting.
Q3: Why is Random Forest preferred over other algorithms? It is preferred due to its versatility, ability to handle large datasets with higher dimensionality, and capacity to manage missing values, making it robust against overfitting.
Q4: What are the main applications of Random Forest? It’s widely used in various fields, such as banking, medicine, the stock market, and e-commerce, for fraud detection, disease prediction, stock price prediction, and customer segmentation.
Q5: How do you prepare data for Random Forest? Data preparation involves cleaning, handling missing values, encoding categorical variables, and splitting the dataset into training and testing sets.
Q6: What are hyperparameters in Random Forest, and how do they affect the model? Hyperparameters influence the model’s complexity and performance, such as the number of trees, depth of trees, and minimum samples split. Tuning these can significantly improve accuracy.
Q7: How can you evaluate the effectiveness of a Random Forest model? Standard evaluation metrics include accuracy, precision, recall, F1 score, and the confusion matrix, which help assess the model’s predictive performance and accuracy.
Q8: What are some challenges in using Random Forests? While powerful, Random Forests can be computationally intensive and challenging to interpret compared to simpler models, and their performance can be sensitive to noisy data.
Q9: How do you tune a Random Forest model for better performance? Model tuning involves adjusting hyperparameters like the number of trees, max depth, and min samples split through grid or random search techniques to find the most optimal settings.
Q10: Can Random Forest handle both categorical and numerical data? Yes, Random Forest can handle a mix of categorical and numerical data. It uses techniques like one-hot encoding for categorical variables to make the data suitable for modeling.