Linear Regression with Scikit-Learn: A Comprehensive Guide
You will learn the art and science of predictive modeling with linear regression with scikit-learn.
Introduction
Linear regression is a foundational technique in data science, enabling the prediction and interpretation of relationships between variables. At its core, linear regression models the relationship between a dependent variable and one or more independent variables, using a linear equation to predict the outcome. This simplicity and its interpretability make linear regression a vital tool for data analysts and scientists across various disciplines.
This article aims to provide a comprehensive guide on implementing linear regression with scikit-learn, a popular Python library for machine learning. Scikit-learn offers a wide array of tools and algorithms for data analysis and modeling, making it an ideal choice for both beginners and experienced practitioners in the field.
In this guide, we will delve into linear regression’s theoretical underpinnings and practical applications. Starting with the basics, we will explore the assumptions and mathematics that underlie linear regression models. From there, we will transition into practical, hands-on examples using scikit-learn to prepare data, build linear regression models, and interpret their results. To illustrate these concepts, we may utilize a dataset created previously, demonstrating the process of linear regression analysis from data preprocessing to model evaluation.
By blending theoretical knowledge with practical skills, this guide aims to equip readers with a thorough understanding of linear regression in the context of scikit-learn, preparing them to apply these concepts to real-world data science challenges.
Highlights
- Linear regression with scikit-learn can predict outcomes with remarkable accuracy.
- Scikit-learn’s API simplifies complex statistical analyses into understandable steps.
- Data preprocessing in scikit-learn enhances model reliability and integrity.
- Advanced techniques in scikit-learn address overfitting, improving model precision.
- Real-world applications of linear regression with scikit-learn drive impactful decisions.
Ad Title
Ad description. Lorem ipsum dolor sit amet, consectetur adipiscing elit.
Understanding Linear Regression
Linear regression is a pivotal statistical method that reveals the underlying relationship between two or more variables. Fitting a linear equation to observed data allows us to understand and predict the behavior of one variable based on the knowledge of another. This predictive modeling technique is not just about finding a line that best fits the data but about uncovering the truths hidden within the data, thus enabling informed decision-making.
At its core, linear regression operates under a set of assumptions that ensure its practical application:
Linearity: The relationship between the independent and dependent variables is linear. This foundational assumption means that a change in an independent variable will result in a proportional change in the dependent variable.
Independence: Observations are independent of each other. The outcome of each data point does not depend on the outcomes of other data points.
Homoscedasticity: The variance of error terms (residuals) is constant across all levels of the independent variables. Homoscedasticity ensures that the model’s predictive accuracy is uniform across the range of the independent variable.
Normal Distribution of Errors: The errors in the dependent variable are normally distributed for any fixed value of the independent variable. This assumption allows us to make inferences and hypothesis testing about the coefficients representing the independent variables.
Understanding these assumptions is crucial for adequately applying linear regression, as violations of these assumptions can lead to inaccurate models and misleading results. By ensuring that the data meets these prerequisites, practitioners can leverage linear regression to its fullest potential, making it a powerful tool for interpreting complex datasets.
Using scikit-learn for linear regression involves preparing the data to meet these assumptions, followed by model fitting, evaluation, and interpretation. Through this process, linear regression with scikit-learn becomes not just a mathematical formula but a bridge between data and decision, theory, and application, guiding us toward more informed and accurate predictions.
Introduction to Scikit-Learn
Scikit-learn stands as a beacon in the data science community, a testament to the collaborative spirit and open-source ethos that drive innovation in this field. As a library, scikit-learn offers a comprehensive suite of machine learning tools, from data preprocessing and model selection to evaluation and tuning. Its design principles prioritize ease of use, performance, and versatility, making it accessible to novices while robust enough for expert practitioners.
The library’s commitment to high-quality documentation and community engagement further exemplifies the best practices in software development for scientific and educational purposes. Scikit-learn is a collection of algorithms and a platform for learning, experimentation, and discovery. Its architecture encourages best practices in data modeling, ensuring that users can access state-of-the-art machine-learning techniques and understand their principles.
By leveraging scikit-learn for linear regression and beyond, data scientists can build predictive models with confidence and clarity. The library’s implementation of linear regression, through the ‘LinearRegression’ class, provides a powerful yet intuitive interface for fitting models to data, analyzing their performance, and making predictions. Whether you are exploring simple linear relationships or delving into more complex, multidimensional datasets, scikit-learn serves as a reliable guide through the intricacies of machine learning, embodying the collective wisdom and effort of the global data science community.
Preparing Your Data
Before diving into the modeling phase with scikit-learn, it’s imperative to prepare your data meticulously to ensure the integrity and truthfulness of your analysis. Data preprocessing is a critical step in the machine learning pipeline, involving cleaning, selecting features, and splitting the data into training and testing sets.
Feature Selection: Begin by identifying the features that have the most significant impact on your dependent variable. Not all data points are created equal; some may have little to no influence on your outcomes and can introduce noise if included.
Data Cleaning: This step involves handling missing values, outliers, and possibly erroneous data that can skew your model’s results. Options for dealing with missing data include imputation, filling in missing values based on other data points, omission, and removing data points or features with missing values.
Data Splitting: Splitting your data into training and testing sets is crucial. This practice allows you to train your model on one subset of your data and test its performance on a separate, unseen subset, providing an unbiased evaluation of your model.
Let’s consider our previously created dataset for a hands-on example:
import pandas as pd
from sklearn.model_selection import train_test_split
from sklearn.linear_model import LinearRegression
from sklearn.metrics import mean_squared_error

# Load the dataset
data = pd.read_csv('/mnt/data/linear_regression_scikit_learn_dataset.csv')

# Feature selection
X = data[['TV', 'Radio']]  # Independent variables
y = data['Sales']  # Dependent variable

# Split the data into training and testing sets
X_train, X_test, y_train, y_test = train_test_split(X, y, test_size=0.2, random_state=42)

# Model initialization and training
model = LinearRegression()
model.fit(X_train, y_train)

# Model evaluation
y_pred = model.predict(X_test)
mse = mean_squared_error(y_test, y_pred)
print(f'Mean Squared Error: {mse}')
In this example, we’ve prepared our data by selecting relevant features (‘TV’ and ‘Radio‘ advertising budgets) and the target variable (‘Sales’). We’ve then split our data into training and testing sets to ensure our model can be evaluated fairly. Following these steps ensures our model is robust, accurate, and reflective of the truths of the underlying data.
Implementing Linear Regression with Scikit-Learn
Implementing linear regression with scikit-learn is straightforward and exemplifies the library’s simplicity and power. The clarity of scikit-learn’s API makes even complex analyses accessible and understandable, allowing data scientists to focus on insights rather than the intricacies of the algorithms.
Download the dataset!
Step 1: Import Libraries and Load Data – Start by importing the necessary libraries and loading your dataset. We’ll use the dataset we previously prepared:
import pandas as pd
from sklearn.model_selection import train_test_split
from sklearn.linear_model import LinearRegression
from sklearn.metrics import mean_squared_error, r2_score

data = pd.read_csv('/mnt/data/linear_regression_scikit_learn_dataset.csv')
Step 2: Select Features and Target – Identify your independent variables (features) and dependent variable (target). In our case, ‘TV’ and ‘Radio’ are the features, and ‘Sales’ is the target:
X = data[['TV', 'Radio']]  # Features
y = data['Sales']  # Target
Step 3: Split Data into Training and Testing Sets – To evaluate the model’s performance effectively, split your data into training and testing sets:
X_train, X_test, y_train, y_test = train_test_split(X, y, test_size=0.2, random_state=42)
Step 4: Initialize and Train the Linear Regression Model – Scikit-learn makes model initialization and training remarkably simple:
model = LinearRegression()
model.fit(X_train, y_train)
Step 5: Make Predictions and Evaluate the Model – With the model trained, you can now make predictions on the test set and evaluate the model’s performance:
y_pred = model.predict(X_test)
mse = mean_squared_error(y_test, y_pred)
r2 = r2_score(y_test, y_pred)

print(f"Mean Squared Error: {mse}")
print(f"R² Score: {r2}")
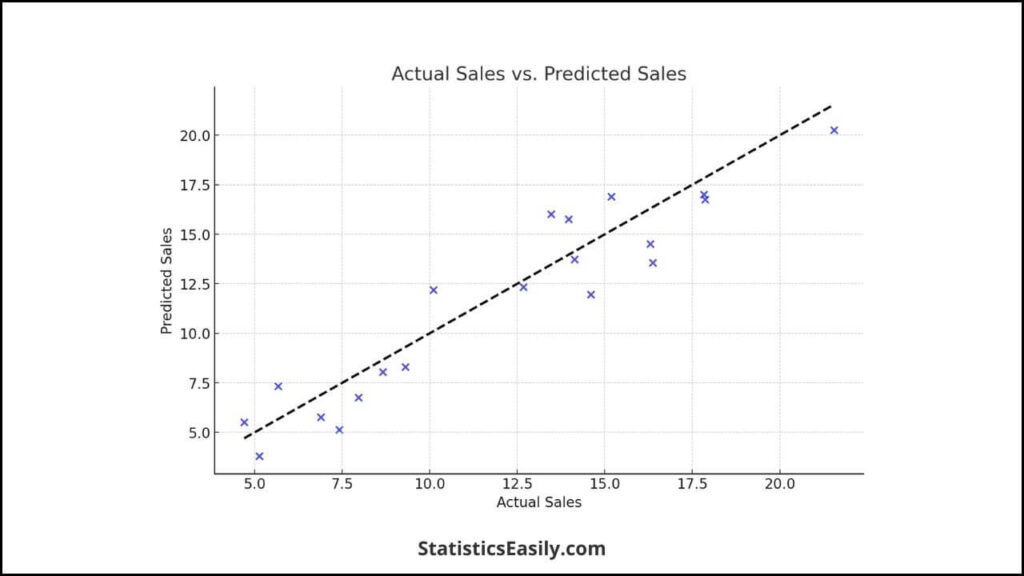
Visualizing the Model’s Performance – Visual representations can provide intuitive insights into the model’s performance. For example, plotting actual vs. predicted sales:
import matplotlib.pyplot as plt

plt.scatter(y_test, y_pred)
plt.xlabel('Actual Sales')
plt.ylabel('Predicted Sales')
plt.title('Actual Sales vs. Predicted Sales')
plt.show()
This simple scatter plot provides a quick visual assessment of the model’s predictive accuracy, with points closer to the line y = x indicating better performance.
Through these steps, scikit-learn demystifies the process of implementing linear regression, making it accessible to beginners and seasoned practitioners. By following this guide, you can leverage the power of linear regression to uncover meaningful insights from your data, armed with the clarity and simplicity of scikit-learn’s API.
Interpreting Results
Interpreting the output of a regression model is a critical step in the analytical process, providing insights into the relationships between variables and the model’s predictive power. In this section, we interpret the linear regression model created with scikit-learn, focusing on the significance of coefficients, model metrics, and ethical considerations in presenting findings.
Coefficients Interpretation
The coefficients in a linear regression model represent the change in the dependent variable for a one-unit change in an independent variable, holding all other variables constant. In our model, the coefficients for ‘TV’ and ‘Radio’ advertising budgets indicate their respective impacts on ‘Sales’. A positive coefficient suggests a direct relationship: an increased advertising budget leads to increased sales. In contrast, a negative coefficient indicates an inverse relationship.
Model Metrics
Two key metrics for evaluating the performance of a linear regression model are the Mean Squared Error (MSE) and the R-squared (R²) value.
MSE measures the average of the squares of the errors, i.e., the average squared difference between the estimated values and the actual value. A lower MSE indicates a model that closely fits the data.
R² represents the proportion of the variance in the dependent variable that is predictable from the independent variables, ranging from 0 to 1. An R² value closer to 1 indicates a model that explains a large portion of the variance in the dependent variable.
Honest Interpretation and Ethical Considerations
When interpreting and presenting the results of a regression analysis, honesty, and ethical considerations are paramount. It’s essential to acknowledge the model’s limitations, including any assumptions that may not hold entirely true or variables that could not be accounted for. Overstating the model’s accuracy or predictive power can lead to misguided decisions and misinterpretations.
Transparency about the data sources, preprocessing steps, and the rationale behind choosing specific variables fosters trust and credibility in the findings. Furthermore, every data scientist is ethically responsible for considering the potential impact of these findings on stakeholders and ensuring that the interpretations do not mislead or harm.
Interpreting the results of a linear regression model involves carefully examining the coefficients and model metrics, coupled with a commitment to honesty and ethical integrity in presenting the findings. This approach ensures the reliability of the analysis and upholds the principles of truth in data science.
Linear Regression with Scikit-Learn Advanced Topics
Several advanced techniques emerge in the pursuit of refining linear regression models and enhancing their predictive accuracy. These methods address common challenges like overfitting and deepen our understanding of linear regression analysis, showcasing its versatility and depth.
Regularization: A Key to Mitigating Overfitting
Regularization techniques such as Ridge (L2 regularization) and Lasso (L1 regularization) prevent overfitting. This common pitfall occurs when the model performs well on training data but poorly on unseen data. By introducing a penalty term to the loss function, regularization methods constrain the magnitude of the coefficients, thus discouraging the model from becoming overly complex.
Ridge Regression adds a penalty equal to the square of the magnitude of coefficients, effectively shrinking them and reducing model complexity.
Lasso Regression, on the other hand, can reduce some coefficients to zero, perform feature selection, and offer a more interpretable model.
Implementing these in scikit-learn is straightforward:
from sklearn.linear_model import Ridge, Lasso

# Ridge regression
ridge_model = Ridge(alpha=1.0)
ridge_model.fit(X_train, y_train)

# Lasso regression
lasso_model = Lasso(alpha=0.1)
lasso_model.fit(X_train, y_train)
The ‘alpha’ parameter controls the strength of the regularization, with higher values leading to more significant constraints on the coefficients.
Model Evaluation and Validation Techniques
Evaluating and validating the performance of linear regression models is crucial for ensuring their reliability and accuracy. Cross-validation, a robust technique, involves dividing the dataset into several subsets and training the model on some subsets while testing it on the remaining ones. This approach provides a more comprehensive assessment of the model’s performance across different data segments.
from sklearn.model_selection import cross_val_score

# Cross-validation with 5 folds
scores = cross_val_score(model, X, y, cv=5, scoring='neg_mean_squared_error')
The ‘cross_val_score’ function in scikit-learn facilitates cross-validation, with the ‘cv’ parameter specifying the number of folds. The choice of scoring metric, such as negative mean squared error, depends on the specific goals of the analysis.
Pursuit of Truth and Accuracy in Model Performance
Adhering to the principles of truth and accuracy is paramount when advancing linear regression analysis through techniques like regularization and cross-validation. Regularization addresses the truthfulness of the model by preventing it from fitting noise. At the same time, cross-validation ensures the accuracy of the model’s performance metrics by providing a holistic evaluation.
The ethical presentation of data findings, acknowledging the limitations and potential biases of the model, reinforces the integrity of the analysis. These advanced techniques and ethical considerations ensure that linear regression analysis continues to be a powerful tool in the data scientist’s arsenal, capable of uncovering insights with precision and reliability.
Linear Regression with Scikit-Learn in Real-World Applications
The application of linear regression within the realm of scikit-learn extends far beyond theoretical constructs, deeply embedding itself in the fabric of real-world problem-solving. This section illuminates the practical utility of linear regression in scikit-learn, through vivid illustrations of its application across diverse domains, underscoring the transformative impact of data science on society.
Predicting Housing Prices: One of the quintessential applications of linear regression is in the real estate industry, where it’s employed to predict housing prices based on various features like square footage, location, number of bedrooms, and age of the property. By training a linear regression model on historical data, real estate analysts can estimate properties’ market value, guiding buyers and sellers in making informed decisions.
Forecasting Sales and Revenue: Businesses across sectors leverage linear regression to forecast sales and revenue, considering advertising spend, seasonal trends, and economic indicators. For instance, a retail company might use linear regression to understand the impact of an advertising campaign on sales, enabling strategic allocation of marketing budgets for maximum return on investment.
Healthcare: Predicting Disease Progression: In healthcare, linear regression models are instrumental in predicting disease progression based on patient data such as age, weight, blood pressure, and cholesterol levels. This application not only aids in early diagnosis and personalized treatment plans but also in efficiently allocating healthcare resources.
Energy Consumption Analysis: Energy sector analysts use linear regression to predict consumption patterns based on historical data, weather conditions, and economic activity. Such predictive insights are crucial for energy generation and distribution companies to manage supply and demand effectively, contributing to sustainable energy management practices.
Success Story: Enhancing Agricultural Yield: A notable success story is the application of linear regression in agriculture to predict crop yields. By analyzing variables like rainfall, temperature, soil quality, and crop variety, agronomists can forecast yields, thus optimizing agricultural practices for enhanced productivity. This boosts food security and supports sustainable farming by minimizing waste and resource use.
These real-world applications underscore the versatility and practicality of linear regression with scikit-learn in addressing complex challenges across various domains. By harnessing the power of data, linear regression models illuminate paths to insightful decisions, driving progress and fostering a positive impact on society. Through these narratives, we witness the embodiment of the principles of truth, goodness, and beauty in the application of data science, reaffirming the profound role of linear regression in shaping a better future.
Ad Title
Ad description. Lorem ipsum dolor sit amet, consectetur adipiscing elit.
Conclusion
In traversing the landscape of linear regression with scikit-learn, we’ve embarked on a comprehensive journey through the theoretical bedrock and practical implementations of one of data science’s most fundamental techniques. Linear regression is a beacon for predicting and interpreting the intricate dance between dependent and independent variables, its elegance in its simplicity and interpretability.
This guide has endeavored to equip you, the reader, with a robust understanding of linear regression within the scikit-learn framework, marrying the theoretical underpinnings with hands-on applications. From the initial steps of grappling with the core assumptions that underlie linear regression models to the practical exercises of data preparation, model building, and interpretation of results, we have traversed a path that blends theory with practice, insight with application.
Scikit-learn, with its rich repository of tools and algorithms, has proven to be an invaluable ally in this journey. Its user-friendly API and extensive documentation have demystified complex statistical analyses, making the power of linear regression accessible to all who seek to unlock the patterns hidden within their data.
The real-world applications highlighted herein — from predicting housing prices to forecasting sales, advancing healthcare, and optimizing agricultural yields — underscore the pervasive impact of linear regression in driving informed decisions across various sectors. These narratives showcase the utility of linear regression and celebrate the transformative power of data science in society.
As we conclude this comprehensive guide, let the journey not end here. The field of linear regression, particularly within the scikit-learn ecosystem, is vast and ripe with potential for exploration. I encourage you to delve deeper, experiment with your datasets, and discover how linear regression can illuminate the unknown, guide strategic decisions, and contribute to the greater good.
Recommended Articles
Explore more insights and elevate your data science journey with our other in-depth articles on similar topics.
- What’s Regression Analysis? A Comprehensive Guide for Beginners
- How to Report Results of Multiple Linear Regression in APA Style
- How to Report Simple Linear Regression Results in APA Style
- Assumptions in Linear Regression: A Comprehensive Guide
- How to Calculate Residuals in Regression Analysis?
- Linear Regression Analysis: Plotting Lines in R
Frequently Asked Questions (FAQs)
Q1: How to do linear regression with Scikit? Use scikit-learn’s ‘LinearRegression’ class to efficiently model and predict relationships between independent and dependent variables.
Q2: What is a linear regression score? The score refers to the coefficient of determination R² of the prediction, which measures the proportion of variance in the dependent variable that is predictable from the independent variable(s).
Q3: How do you import a linear regression in Python? Use’ from sklearn. linear_model import LinearRegression’ to import the ‘LinearRegression’ class from scikit-learn’s ‘linear_model’ module.
Q4: What is the intercept and coefficient of a linear regression in Python? The intercept is the value of the dependent variable when all independent variables are zero. Coefficients are the values that multiply the independent variable values, representing their relationships with the dependent variable.
Q5: How do I interpret linear regression coefficients in Scikit-Learn? Coefficients indicate the expected change in the dependent variable for a one-unit change in each independent variable, holding other variables constant.
Q6: What is overfitting, and how can it be addressed? Overfitting happens when a model captures noise instead of the underlying pattern. Techniques like cross-validation and regularization within scikit-learn mitigate this issue.
Q7: Can Linear Regression handle categorical variables? Using techniques like one-hot encoding, categorical variables can be effectively incorporated into linear regression models in scikit-learn.
Q8: How do I validate a linear regression model? Validation involves using techniques like cross-validation and assessing performance metrics such as R² and RMSE to ensure the model’s accuracy and reliability.
Q9: How can the accuracy of a linear regression model be improved? Improving accuracy can involve feature engineering, such as selecting relevant variables and applying regularization techniques like Ridge or Lasso to reduce overfitting and enhance model performance.
Q10: What are some typical real-world applications of linear regression? Linear regression is widely applied in forecasting (such as sales and weather), risk assessment in finance and insurance, and evaluating trends and relationships in scientific research, showcasing its versatility across various domains.