Descriptive vs. Inferential Statistics: A Comprehensive Guide
Understanding the difference between descriptive vs. inferential statistics is crucial in today’s data-driven world. This guide is designed to help you grasp these two fundamental statistics principles and their practical applications in data analysis.
Introduction
Statistics, at its core, is about extracting meaning from data. It is a discipline that incorporates several interconnected elements — collection, organization, analysis, interpretation, and presentation of data.
In general, statistical methods can be divided into two categories: descriptive vs. inferential statistics. Both play an essential role in data analysis but serve distinct purposes and are used in different scenarios.
Highlights
- Descriptive statistics summarize data, providing simple, clear insights.
- Inferential statistics allow for predictions and hypotheses about broader populations.
- Measures of central tendency and variability form the basis of descriptive statistics.
- Hypothesis testing, including regression analysis and ANOVA, is central to inferential statistics.
Ad Title
Ad description. Lorem ipsum dolor sit amet, consectetur adipiscing elit.
Understanding Descriptive Statistics
Descriptive statistics constitute a critical component of data analysis. They provide a way to summarize, visualize, and comprehend an extensive data set without resorting to complex calculations or analyses.
This branch of statistics is concerned with the presentation and summarization of data. It provides simple, straightforward summaries of the sample and its measures, ensuring a comprehensive yet simplified understanding of the data set. This is often facilitated through graphical representations, tables, or numerical measures.
The purpose of descriptive statistics is to reduce a complex data set to a more straightforward summary. This involves measures of central tendency (mean, median, mode) and variability (range, variance, standard deviation). These measures provide insights into the “average” observations and the degree of variation within the data, respectively.
Moreover, descriptive statistics also encompass measures of position (percentiles, quartiles) and shape (skewness, kurtosis). These provide further insights into the distribution and the nature of the data.
Descriptive statistics play an indispensable role in the preliminary stages of data analysis, providing a foundation upon which more complex inferential techniques can be applied. They are widely used across various fields — from business and finance to social and natural sciences. For example, the average score on a test, the proportion of the population of a specific nationality, or the percentage of people who finish a given task in a certain amount of time; all utilize descriptive statistics.
In essence, descriptive statistics provide a powerful summary of information, serving as a lens through which we can understand the critical characteristics of our data without needing to examine each observation.
Understanding Inferential Statistics
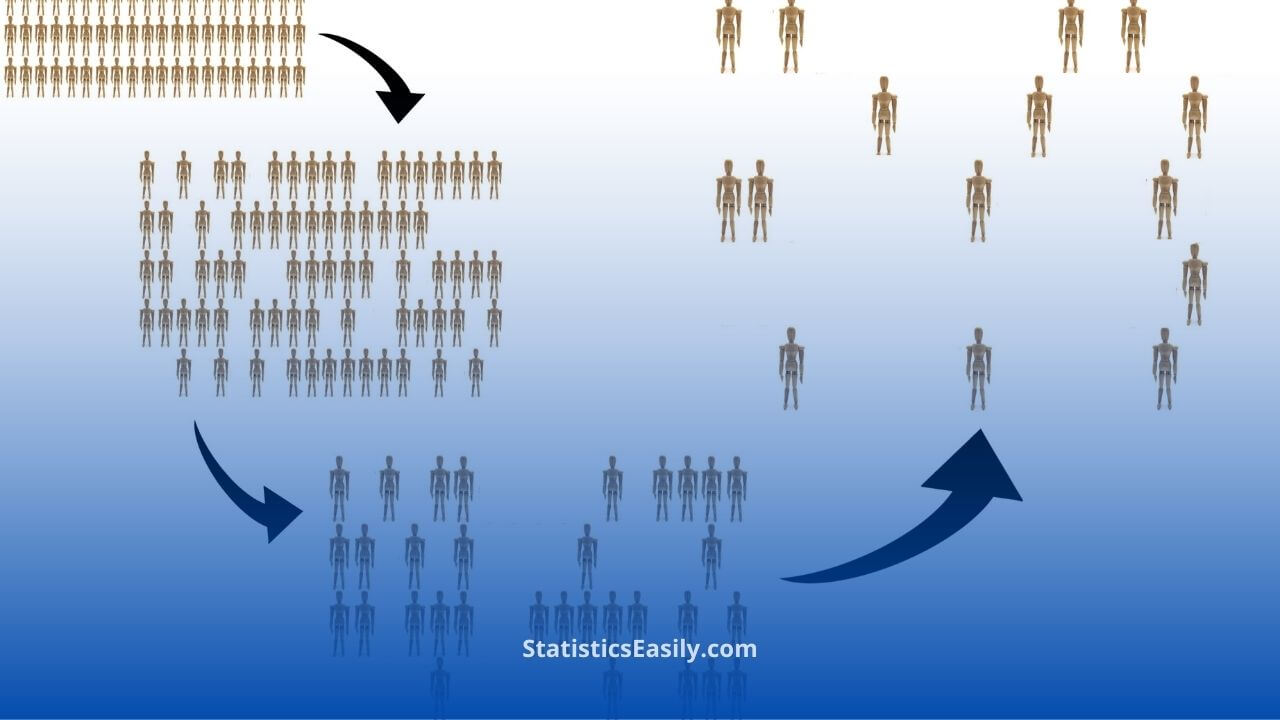
In contrast to descriptive statistics, inferential statistics involves making predictions or inferences about a larger population from observations made in a sample. It is all about making inferences from data.
Inferential statistics aims to draw and generalize conclusions from a sample to the larger population. It helps us interpret the population from which we draw our sample.
For example, suppose you are trying to infer the preferred political candidate in an upcoming election. In that case, you might poll a sample of voters. You could infer the election’s likely outcome in the entire voting population based on the responses.
Inferential statistics comprises a range of powerful methods that enable researchers to extrapolate from a sample to a population. Central to these are hypothesis testing procedures, which allow us to make statistically-based decisions.
One of the most widely used hypothesis testing methods is regression analysis. This tool enables us to investigate the relationships between dependent and independent variables, making it particularly valuable for prediction and forecasting. Similarly, Analysis of Variance (ANOVA) is another hypothesis testing procedure. It is used to determine if the differences among the means of 3 or more groups are statistically significant.
Beyond these, several other essential hypothesis tests are often employed in inferential statistics. The t-test, for instance, is used to compare the means between two groups. The chi-square test analyzes categorical data, providing insight into observed versus expected outcomes. Correlation tests allow us to understand the degree to which two variables are associated.
These inferential tools, whether regression analysis, ANOVA, t-tests, chi-square, or correlation tests, are critical in extracting meaningful interpretations from datasets and making informed predictions about broader populations.
Contrasting Descriptive vs. Inferential Statistics
Both descriptive and inferential statistics play integral roles in data analysis. However, their objectives, methodologies, and the nature of the insights they provide are fundamentally different.
Descriptive statistics aims to provide a detailed summarization of a dataset. This can involve measures of central tendency like the mean, median, or mode, which give a sense of the “average” data point. It may also include measures of variability such as the range, standard deviation, or variance, which provide insights into the spread of the data. Descriptive statistics condense a large dataset into a simplified but informative snapshot, giving a clear picture of the dataset without drawing conclusions beyond what is immediately apparent.
For example, suppose a business conducts a customer satisfaction survey. In that case, descriptive statistics might reveal that 85% of respondents are satisfied with their service. This provides valuable but surface-level insight into the data collected.
In contrast, inferential statistics allows analysts to extrapolate and make predictions or hypotheses about a larger population based on their sample data. It uses complex mathematical models to estimate parameters and to test hypotheses. This can provide broader insights into trends, patterns, and relationships within the data, enabling analysts to make educated guesses or inferences about future events or unseen populations.
Taking the earlier example forward, inferential statistics could be used to infer that not just 85% of the survey respondents, but 85% of all customers, are likely to be pleased with the service. This conclusion is based on the supposition that the survey sample represents the broader customer base.
| Descriptive Statistics | Inferential Statistics | |
|---|---|---|
| Purpose | Summarizes data | Makes predictions |
| Methods | Mean, Median, Mode, Range, Standard Deviation, Variance | Hypothesis Testing, Regression Analysis, ANOVA, t-tests, Chi-square Tests, Correlation Tests |
| Insights | Provides data summaries such as central tendency and variability | Provides insights into patterns, relationships, and predictions about broader populations |
| Use | Used in the preliminary stages of data analysis | Used to make conclusions or predictions about a larger population based on sample data |
| Example | Calculating the average customer satisfaction score from a survey | Inferring the satisfaction level of the entire customer base based on the survey results |
In summary, while descriptive statistics provide an overview of the data, inferential statistics goes further, making predictions and drawing conclusions about a larger population. It’s important to remember that neither type is superior to the other; instead, they are complementary tools in the toolbox of a data analyst or researcher, each serving its unique purpose in the quest to glean meaningful insights from data.
Ad Title
Ad description. Lorem ipsum dolor sit amet, consectetur adipiscing elit.
Recommended Articles
Continue exploring the world of statistics by checking out other informative and relevant articles on our blog!
- Descriptive Statistics vs. Inferential Statistics: Simplifying Data Analysis
- Join the Data Revolution: A Layman’s Guide to Statistical Learning
- How Statistics Can Change Your Life: A Guide for Beginners
- Inferential Statistics – an overview (External Link)
- Statistics is the Grammar of Science
- Master Paired t-Tests (Story)
Frequently Asked Questions (FAQ)
It’s a method of summarizing data, offering clear insights into the sample.
It’s a method of making predictions or hypotheses about a larger population based on sample data.
Examples include measures of central tendency (mean, median, mode) and variability (range, variance, standard deviation).
Examples include hypothesis testing procedures such as regression analysis, ANOVA, t-tests, chi-square, and correlation tests.
While descriptive statistics summarize the data, inferential statistics make predictions and draw conclusions about a larger population.
Descriptive statistics are often the preliminary data analysis stage and form the foundation for inferential statistics.
Hypothesis testing allows analysts to make statistically-based decisions about a larger population based on sample data.
Correlation tests allow us to understand the degree to which two variables are associated.
Descriptive statistics provide valuable insights but do not allow for predictions about broader populations, which is where inferential statistics come in.
Both are equally important and serve complementary roles in data analysis.


Thank your for this valuable insights you have provided to me about the difference between Inferential and descriptive statistics. I am pursuing a PhD but I am not statistics smart.