Standard Deviation Rules Misconceptions


Standard deviation is a statistical measure that helps to understand the spread of data around the mean. However, there are some common misconceptions about the rules of standard deviation that can lead to incorrect data analysis. In this guide, we’ll explore the truth about standard deviation rules and how to use them correctly.
Standard deviation is a widely used measure of the dispersion, variability, or spread of a set of data points. It provides an indication of how much the individual data points deviate from the mean (average) of the dataset. A low standard deviation indicates that the data points are closely clustered around the mean, whereas a high standard deviation indicates that the data points are more spread out from the mean.
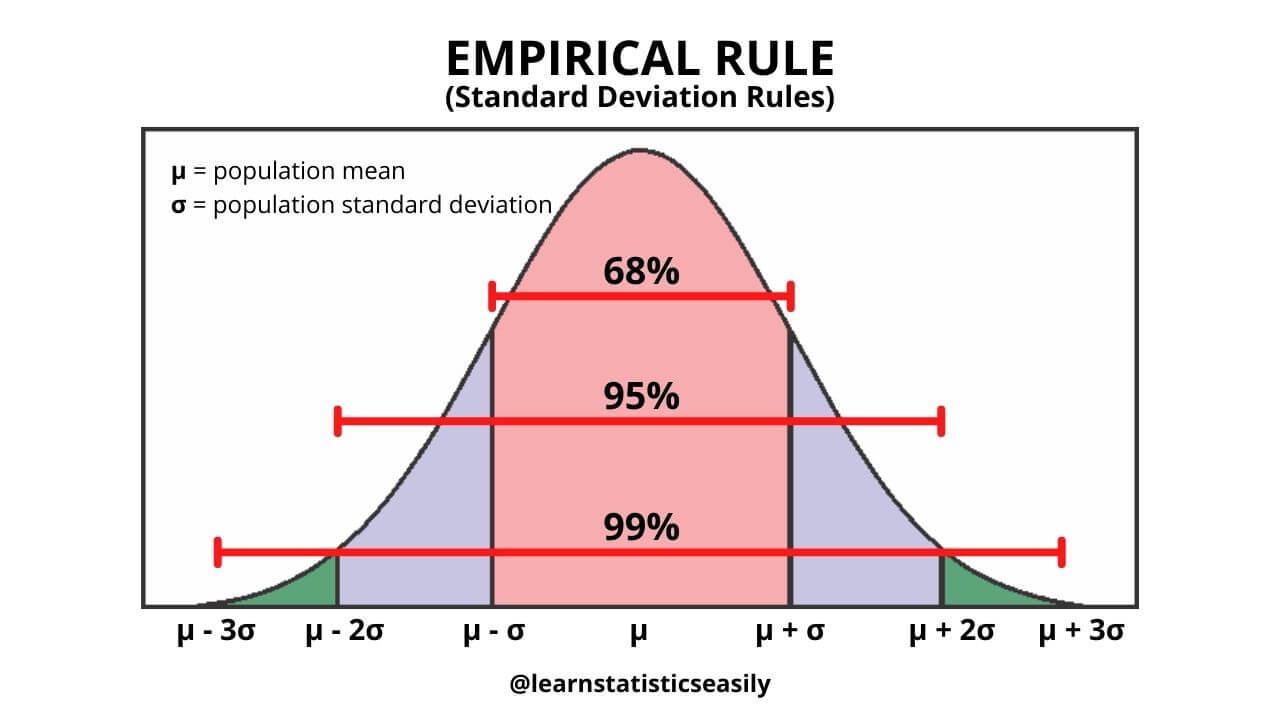
The Standard Deviation Rules, also known as the Empirical Rule or the 68-95-99.7 Rule, provide a rough guideline for understanding the distribution of data within a normal (Gaussian) distribution. These rules are based on the properties of the normal distribution, which is symmetric and bell-shaped. The rules are as follows:
1. Approximately 68% of the data falls within one standard deviation of the mean (μ ± 1σ).
2. Approximately 95% of the data falls within two standard deviations of the mean (μ ± 2σ).
3. Approximately 99.7% of the data falls within three standard deviations of the mean (μ ± 3σ).
The standard deviation (σ) is a measure of the dispersion or spread of a dataset, and the mean (μ) is the average of the dataset. These rules help provide a quick understanding of the distribution of the data in a normal distribution, allowing for the identification of outliers or unusual data points.
There are several common misconceptions about the standard deviation rules, or the Empirical Rule, which can lead to confusion or misinterpretation of data.
The Empirical Rule only applies to normal (Gaussian) distributions. For other types of distributions, such as skewed or bimodal distributions, the percentages within each standard deviation from the mean may be different. It’s important to determine whether a dataset follows a normal distribution before applying the standard deviation rules.
While the Empirical Rule provides a useful approximation for the percentage of data within 1, 2, and 3 standard deviations from the mean (68%, 95%, and 99.7%, respectively), these percentages are not exact. They are rounded approximations, and the actual percentages may be slightly different.
Standard deviation (σ) measures the variability within a dataset, while standard error (SE) measures the variability of a sample statistic (like the mean) across multiple samples from the same population. While both use the concept of dispersion, they serve different purposes and should not be confused with one another.
The Empirical Rule is based on the assumption that the data follows a normal distribution. For small sample sizes, the normality assumption might not hold, and the standard deviation rules may not apply. As the sample size increases, the central limit theorem comes into play, stating that the distribution of sample means approaches a normal distribution, regardless of the shape of the population distribution.
The Empirical Rule suggests that approximately 99.7% of the data falls within three standard deviations of the mean. This can sometimes be misinterpreted as meaning that outliers beyond three standard deviations are impossible. While it’s rare for data points to fall beyond three standard deviations, they can still occur, especially in large datasets or those with heavy tails.
Understanding the common misconceptions about standard deviation rules is crucial for correctly interpreting and analyzing data. It’s essential to recognize that the Empirical Rule applies only to normal distributions, and its percentages are approximate, not exact. Moreover, standard deviation and standard error serve different purposes and should not be confused with each other. Sample size plays a significant role in determining the applicability of standard deviation rules, and the normality assumption should always be considered. Finally, although rare, outliers beyond three standard deviations are possible and should not be dismissed outright. By being aware of these misconceptions and using standard deviation rules correctly, we can avoid misinterpretations and improve the accuracy and reliability of our data analyses.
Eager to analyze your data and report results accurately for the most critical inferential analyses?
Don’t hesitate to download FREE samples of our newly released digital book!
Inside, you’ll learn to analyze your data, calculate sample sizes, and report results in a straightforward and concise manner.
Click this link and discover all it has to offer: Applied Statistics: Data Analysis.

Master the “pandas rename column” operation with this guide. Learn how to rename columns in your DataFrame.

Master Kaplan-Meier Survival Analysis in R and unlock the secrets of time-to-event data analysis, empowering informed decisions.

Discover the critical differences between descriptive vs. inferential statistics, their applications, and how to effectively use them.

Learn how to find Cohen’s d, a crucial statistical measure quantifying the standard difference between two means in data analysis.

Discover the essence of RM ANOVA in our comprehensive guide, mastering within-subject variability analysis for impactful research insights.

Explore the risks of unethical data analysis — ‘If you torture the data long enough, it will confess to anything’ — Learn best practices.