
Kaplan-Meier Survival Analysis in R: Mastering Time-to-Event Data
You will learn how Kaplan-Meier Survival Analysis in R provides invaluable insights into survival data, guiding critical research and decisions.
Introduction
In healthcare research, the ability to accurately predict patient outcomes, especially in terms of survival, is a crucial endeavor. Kaplan-Meier Survival Analysis in R has emerged as an indispensable tool in this quest, offering researchers the means to estimate survival probabilities over time with precision. By leveraging the power of R, a versatile platform for statistical computation, Kaplan-Meier analysis enables the examination of time-to-event data in a manner that is both sophisticated and accessible. This technique is not merely a statistical method; it is a beacon that guides life-saving decisions across medical research and practice, highlighting the significance of statistical analysis in understanding the nuances of patient survival and treatment efficacy.
Highlights
- Kaplan-Meier analysis effectively estimates survival times, aiding life-saving healthcare decisions.
- Addressing data censoring, Kaplan-Meier analysis reveals the entire story behind survival rates.
- Step-by-step guidance for data preparation and analysis in R ensures ethical and rigorous research.
- Interpreting survival curves with Kaplan-Meier illuminates differences in treatment outcomes.
- Advanced Kaplan-Meier applications, including log-rank tests, enhance understanding of survival data.
Ad Title
Ad description. Lorem ipsum dolor sit amet, consectetur adipiscing elit.
Understanding Kaplan-Meier Survival Analysis
Kaplan-Meier Survival Analysis is a pivotal statistical method that estimates survival probabilities over time. Its significance in research cannot be overstated, as it allows for a comprehensive understanding of survival times across various domains, notably in medical research. This analysis is precious in its ability to handle censored data, a common challenge in survival studies. Censoring occurs when the outcome of interest (for example, time to event) is only partially observed for reasons such as patients dropping out of a study or the study ending before all events have occurred. Kaplan-Meier Survival Analysis elegantly addresses this issue by using the information available up to the point of censorship to estimate survival probabilities, thus ensuring that each data point contributes to the overall understanding of the survival curve. This approach enriches the dataset with each individual’s experience. It aligns with pursuing a more nuanced and truthful analysis of survival data.
Preparing Data for Kaplan-Meier Survival Analysis in R
The meticulous preparation of data forms the foundation for any robust Kaplan-Meier Survival Analysis in R. This section outlines the essential steps to prepare your data, ensuring the integrity and dignity of subjects are respected throughout the process. It also highlights ethical considerations crucial for researchers.
Data Collection Principles: Prioritize transparency and consent in your data collection efforts. Ensure participants are fully informed of the study’s scope and the use of their data, aligning with ethical standards that respect individual rights and privacy.
Data Cleaning and Preparation Steps in R:
- Initial Data Review: Begin by loading your dataset into R and conducting a preliminary review. Identify any immediate inconsistencies, missing values, or outliers that could skew your analysis. Utilize functions like str(), summary(), and View() to get an overview of your data structure.
- Handling Missing Data: In survival analysis, missing data can significantly impact the accuracy of your results. Determine if the missingness is random or systematic. Use imputation techniques cautiously, considering the implications of each method on your analysis’ integrity.
- Dealing with Censored Data: Kaplan-Meier analysis specifically addresses censored data but requires clear identification of such instances. Tag your data accordingly, differentiating between right-censored, left-censored, and interval-censored observations.
- Data Transformation: Transform your data into a format suitable for Kaplan-Meier analysis. This typically involves creating a survival object in R using the Surv() function from the survival package. Ensure time-to-event and event/censoring indicators are correctly formatted.
- Exploratory Data Analysis (EDA): Conduct EDA to understand the distribution of key variables, especially time-to-event and censoring indicators. Utilize visualization tools available in R, such as ggsurvplot() from the survminer package, to plot survival curves for different cohorts.
- Ethical Considerations: Throughout the data preparation phase, continuously reflect on the ethical implications of your choices. Ensure that the data manipulation and analysis methods employed do not compromise the dignity or privacy of the subjects. When in doubt, err on caution and consult ethical guidelines relevant to your field.
By adhering to these steps and maintaining a high ethical standard, researchers can effectively prepare their dataset for Kaplan-Meier Survival Analysis in R. This ensures the integrity of the analysis and upholds the principles of respect and dignity for all subjects involved.
Data Formatting Example for Kaplan-Meier Survival Analysis in R
Below is an illustrative example of how data should be formatted for conducting Kaplan-Meier Survival Analysis using R. The dataset consists of two crucial columns: time_to_event, which represents the time until the event of interest or censoring occurs, and event_indicator, indicating whether the event of interest (1) has occurred or the data is censored (0). This example demonstrates the structure and type of data necessary for a robust survival analysis.
| time_to_event | event_indicator |
|---|---|
| 103 | 0 |
| 349 | 0 |
| 271 | 1 |
| 107 | 1 |
| 72 | 1 |
Implementing Kaplan-Meier Survival Analysis in R
Implementing Kaplan-Meier Survival Analysis in R requires a structured approach to effectively understand and interpret survival data. This tutorial will guide you through the necessary steps, utilizing R code snippets for clarity. The goal is to illustrate the process with real-life datasets, showcasing the complexity and depth of life’s survival stories.
Step 1: Install and Load Necessary Packages
Before starting, ensure you have the survival package installed in R. This package provides functions for survival analysis, including Kaplan-Meier estimation. You can also install survminer to enhance visualization capabilities.
install.packages("survival")
install.packages("survminer")

library(survival)
library(survminer)
Step 2: Load Your Dataset
Load your dataset into R. Ensure it includes at least two key components: the time-to-event data and the event indicator (1 if the event has occurred, 0 for censored data).
# Assuming your data is in a CSV file named 'dataset.csv'
data <- read.csv("dataset.csv")
Step 3: Create a Survival Object
Use the Surv() function to create a survival object. This function takes the time-to-event data and the event indicator as arguments.
surv_obj <- Surv(time = data$time_to_event, event = data$event_indicator)
Step 4: Conduct Kaplan-Meier Survival Analysis
Utilize the survfit() function to perform the Kaplan-Meier Survival Analysis on your survival object.
km_fit <- survfit(surv_obj ~ 1) # '~ 1' indicates we're not stratifying by any factor
Step 5: Plot the Survival Curve
The ggsurvplot() function from the survminer package is used to visualize the survival curve.
ggsurvplot(km_fit, data = data, risk.table = TRUE,
           ggtheme = theme_minimal(),
           title = "Kaplan-Meier Survival Curve",
           xlab = "Time", ylab = "Survival Probability")
This plot provides a graphical representation of the survival probabilities over time, with a risk table below showing the number of subjects at risk at various time points.
Step 6: Analyzing and Interpreting the Curve
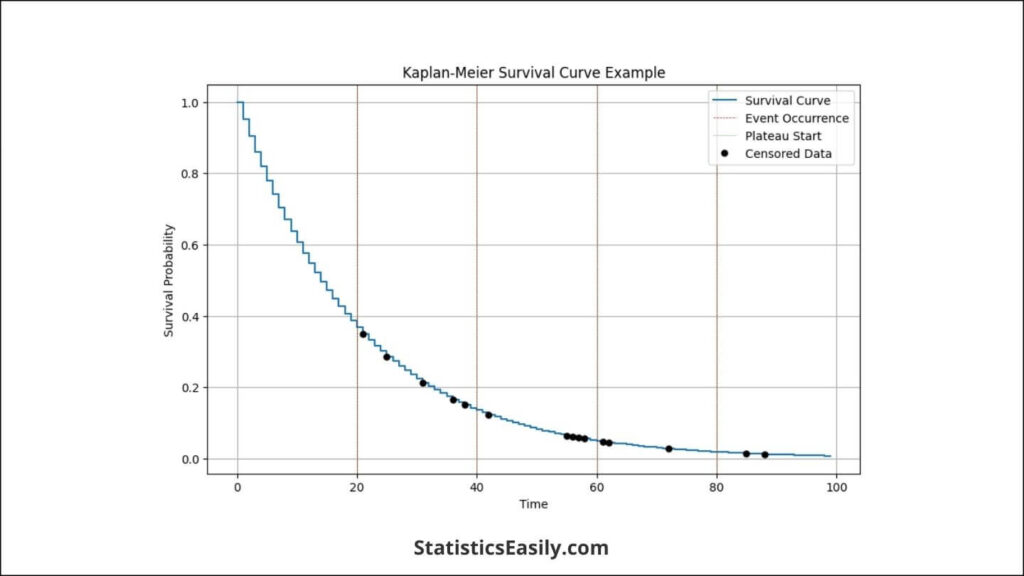
- Survival Probability: The y-axis represents the probability of surviving beyond a given time point.
- Time: The x-axis shows the time since the beginning of the study or treatment.
- Censored Data: Points on the curve indicate censored observations, where a subject’s event time is unknown beyond a certain point.
Real-life Application
Imagine a study on the effectiveness of a new cancer treatment. Your dataset comprises patients’ follow-up times and whether the event of interest (e.g., relapse) occurred. Applying the Kaplan-Meier Survival Analysis, you could estimate the survival function for patients under this new treatment, providing invaluable insights into its effectiveness over time.
By following these steps, researchers can perform Kaplan-Meier Survival Analysis in R, allowing for the rigorous analysis of time-to-event data. This process not only unveils the survival probabilities associated with different treatments or conditions but also deepens our understanding of the data’s underlying stories, reflecting the complexity and resilience of life.
Interpreting the Results
Interpreting the results of Kaplan-Meier Survival Analysis in R transcends the mere visualization of survival curves; it involves a deep dive into the narratives these curves unfold about the populations under study. This section elucidates how to decode the survival function and curves, juxtapose different groups, and underscores the broader implications of such analyses across various fields.
Understanding Survival Functions and Curves
The survival function, plotted through Kaplan-Meier analysis, offers a graphical representation of the probability that an event (e.g., failure, death) has not occurred by a specific time. The y-axis denotes the survival probability, while the X-axis represents time. Key elements to note in the curve include:
- Declines in the Survival Curve: Each drop signifies an event occurrence. The magnitude of these declines can provide insight into the event’s frequency over time.
- Plateaus: These suggest periods where no events were observed, indicating stability in the survival probability during that interval.
- Censored Data Points: Often marked by small vertical ticks on the curve, they indicate censored observations, showing that the data for some subjects were incomplete.
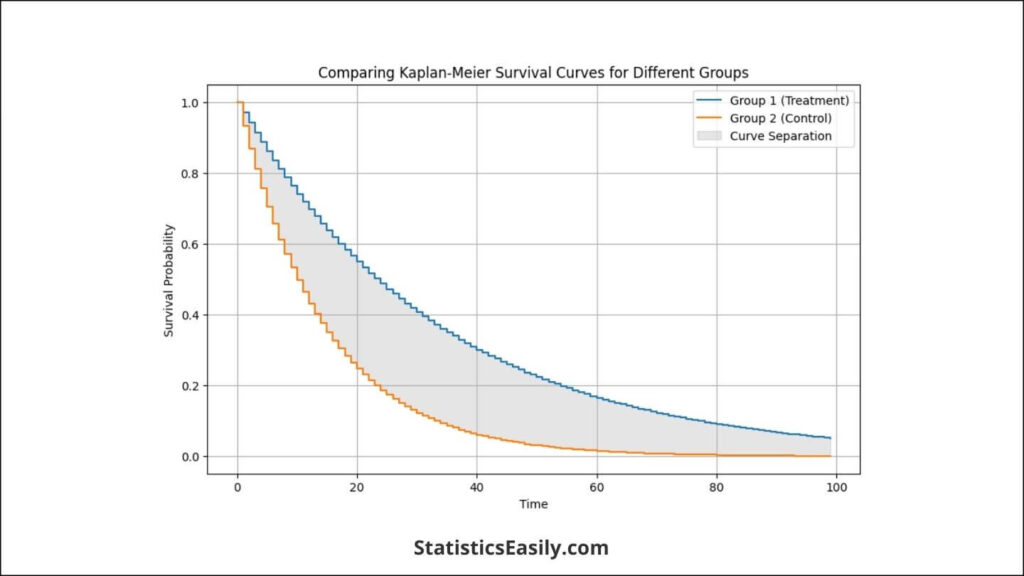
Comparing Different Groups
Kaplan-Meier survival curves can be instrumental in comparing the survival probabilities of different groups within your study (e.g., treatment vs. control groups). When interpreting these comparisons, focus on:
- Curve Separation: Significant separation between the curves of different groups suggests variations in survival experiences, which could be attributable to the studied intervention or condition.
- Crossing Curves: If curves cross, this may indicate that the effect of the treatment varies over time.
Ethical and Practical Implications
The insights drawn from Kaplan-Meier Survival Analysis are pivotal in making informed, ethical decisions across numerous fields. For example, in healthcare, these analyses can inform treatment plans, patient counseling, and policy-making, ultimately contributing to better patient outcomes. In environmental studies, survival analysis might help assess the impact of interventions on the survival of species or ecosystems.
Moreover, integrating the principles of goodness and ethical considerations into statistical practice encourages a holistic approach to data interpretation. It prompts researchers to consider the broader consequences of their findings on society, ensuring their work contributes positively to the collective well-being.
Advanced Applications and Considerations
In the realm of Kaplan-Meier Survival Analysis, exploring advanced topics like the log-rank test is a beacon for statistical rigor and meaningful interpretation of survival data across groups. The log-rank, non-parametric hypothesis test compares the survival distributions of two or more groups. This test is instrumental in identifying significant differences in survival times, thus providing a solid foundation for inferential analysis in survival studies.
Advanced Applications in Survival Analysis
The log-rank test’s application in Kaplan-Meier Survival Analysis extends beyond the mere comparison of survival curves. It delves into the heart of survival data, offering pivotal insights for clinical decision-making, policy formulation, and strategic interventions across various sectors.
The Greater Good: Impacting Healthcare and Environmental Studies
The implications of survival analysis and the log-rank test are profound in healthcare. They inform treatment efficacy, patient management strategies, and broader public health policies to improve patient outcomes. By rigorously comparing survival outcomes across different treatment regimens, healthcare professionals can tailor interventions to maximize patient survival and quality of life.
Similarly, in environmental studies, survival analysis can assess the impact of conservation strategies on species’ survival rates or ecosystems’ resilience to environmental stressors. These analyses contribute to a deeper understanding of ecological dynamics, guiding conservation efforts and policies to preserve biodiversity and sustain ecosystem services.
Ad Title
Ad description. Lorem ipsum dolor sit amet, consectetur adipiscing elit.
Conclusion
In summary, Kaplan-Meier Survival Analysis in R is a critical tool for researchers across various fields, enabling a clear and quantitative understanding of time-to-event data. It allows for precise estimation of survival probabilities, handling complexities such as censored data with statistical rigor. The versatility of R makes it an invaluable asset for performing these analyses, offering a suite of packages that support robust and ethical statistical practices. Through the application of such analyses, we can improve decision-making in healthcare, bolster environmental conservation efforts, and advance scientific knowledge, thereby contributing to the well-being and progress of society.
Recommended Articles
Explore our articles on similar topics to discover more insights and advancements in statistical analysis. Dive deeper into the world of data science with us today!
- What’s Regression Analysis?
- Generalized Linear Models (Story)
- Pearson Correlation Coefficient Statistical Guide
- Logistic Regression Using R: The Definitive Guide
- Understanding Normal Distribution: A Comprehensive Guide
Frequently Asked Questions (FAQs)
Q1: What is Kaplan-Meier Survival Analysis? It’s a statistical method for estimating the probability of survival over time despite data censorship.
Q2: Why is R preferred for Kaplan-Meier Survival Analysis? R offers comprehensive packages and libraries specifically designed for statistical analysis, including survival analysis.
Q3: How does Kaplan-Meier Analysis handle censored data? It incorporates censored data without bias, providing a more accurate estimate of survival probabilities.
Q4: Can Kaplan-Meier Analysis compare different treatment groups? Yes, it can compare the effectiveness of treatments through survival curves and the log-rank test.
Q5: What are the prerequisites for conducting a Kaplan-Meier Analysis? Understanding basic statistics and R programming is essential to performing the analysis accurately.
Q6: How do you interpret the results from Kaplan-Meier Analysis? The survival curve plots time against the probability of survival, showing the impact of variables on survival time.
Q7: Are there limitations to Kaplan-Meier Survival Analysis? It’s best suited for univariate analysis. For multivariate, other techniques like Cox regression are recommended.
Q8: How important is data preparation in Kaplan-Meier Analysis? It is crucial, as accurate data cleaning and preparation directly affect the reliability of the analysis outcomes.
Q9: What is the significance of the survival function in Kaplan-Meier Analysis? It provides a graphical representation of survival probabilities over time, which is crucial for understanding time-to-event outcomes.
Q10: Can Kaplan-Meier Survival Analysis be used in fields other than healthcare? Absolutely. It’s applicable in any field that requires analyzing time-to-event data, such as engineering and finance.