
How Do You Calculate Z-Scores on a TI-84 Calculator?
You will learn the Simple Steps to Calculate Z-Scores on a TI-84 Calculator.
Introduction
In statistical analysis, Z-scores stand out as a fundamental concept, crucial for understanding the relative position of a data point within a dataset. These scores, representing the number of standard deviations a point is from the mean, are pivotal in transforming raw data into meaningful, standardized information. This transformation is essential, especially when comparing data points from different distributions or measuring the significance of individual data points.
Enter the TI-84 calculator, a powerful tool for basic arithmetic and sophisticated statistical computations like calculating Z-scores. This calculator simplifies what could otherwise be a complex and time-consuming calculation, making it accessible even for those new to statistics. In this guide, we will navigate the steps to use your TI-84 calculator to compute Z-scores efficiently, ensuring accuracy and ease in your statistical analysis.
Highlights
- Calculating Z-scores on a TI-84 can be done in a few simple steps.
- Understanding Z-scores is crucial for interpreting standard deviation and variance.
- The TI-84 calculator streamlines complex statistical calculations.
- Z-scores are essential for comparing data from different sets.
- Common errors in calculation can be easily avoided with correct inputs.
Ad Title
Ad description. Lorem ipsum dolor sit amet, consectetur adipiscing elit.
Detailed Step-by-Step Guide
Calculating the Z-Score of an Individual Data Point on the TI-84
1. Enter the Mean and Standard Deviation: First, note your distribution’s mean (μ) and standard deviation (σ). For instance, consider these numbers: μ = 10 and σ = 2.1.
2. Type the Z-Score Formula: Next, you will input the formula to calculate the Z-score of your specific value (x). For example, if x = 15, the formula you would use on the calculator is (15 – 10) / 2.1.
3. Calculate and Interpret the Result: The calculator will display the Z-score after entering the formula. This score indicates how many standard deviations your specific value (x) is from the mean of the distribution. A positive score suggests it is above the mean, and a negative score indicates below.

Calculating Z-Scores for an Entire Dataset on the TI-84
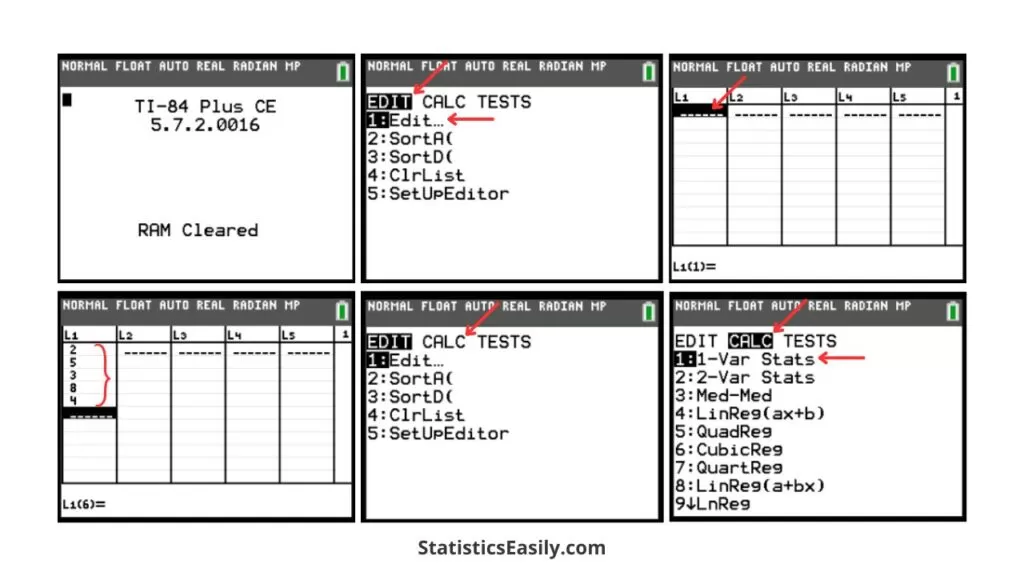
1. Enter Your Data: To enter your dataset into the calculator, press the stat button, select 1:Edit…, and enter your data points into the list L1.
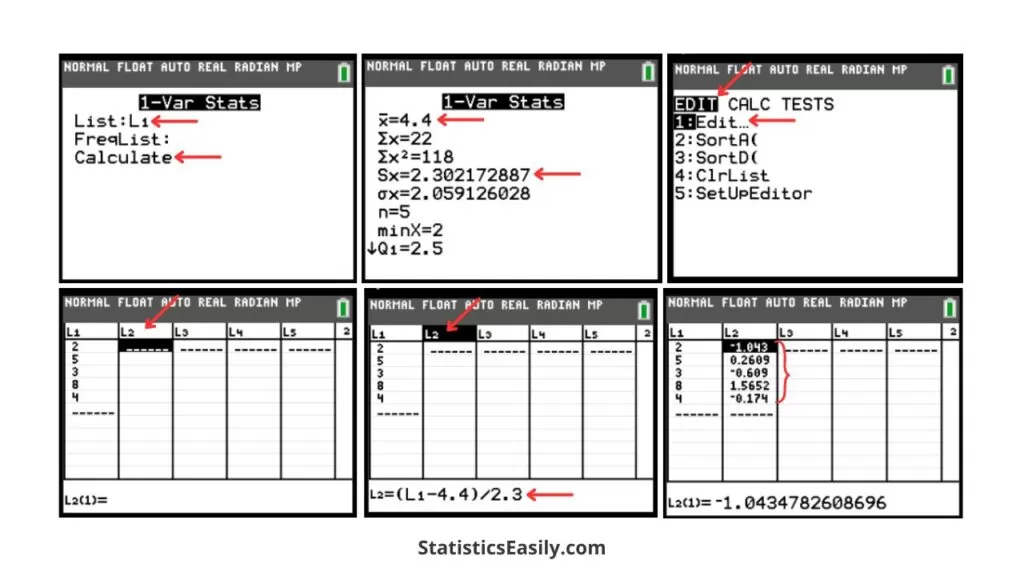
2. Calculate the Mean and Standard Deviation: To find the mean and standard deviation, crucial for computing Z-scores, press stat again, scroll over to CALC, and select 1:1-Var Stats. Then press 2nd, 1 (for L1), scroll to Calculate, and enter. Note the x̄ (mean) and σx (standard deviation) values.
3. Compute Z-Scores for the Dataset: To calculate Z-scores for each value, press stat and then 1:Edit… In L2, enter the formula to calculate Z-scores using the mean and standard deviation obtained earlier. This formula will be in the form (L1-mean)/standard deviation. Apply this formula to get Z-scores in L2.
4. Interpreting the Results: Z-scores in L2 will show how many standard deviations each data point is from the mean. Positive scores indicate above mean values, and negative scores indicate below mean values.
Understanding Z-Scores
Z-scores, a key concept in statistical analysis, offer a standardized way of understanding the position of individual data points in the overall dataset. This standardization is achieved by calculating how many standard deviations a particular data point is from the dataset’s mean.
Practical Examples of Z-Scores in Use:
Academic Performance Analysis: Imagine a class of students with varying scores on a test. By calculating the Z-score for each student’s test score, we can determine how each student performed relative to their peers. A Z-score above 0 indicates above-average performance, while a score below 0 suggests below-average performance.
Financial Market Analysis: In finance, Z-scores compare the performance of different stocks or investment portfolios. For instance, a stock with a high positive Z-score has performed exceptionally well compared to the market average, which can be a signal for investors.
Quality Control in Manufacturing: In manufacturing, Z-scores can help assess the consistency of product dimensions. Products with Z-scores far from 0 might indicate a deviation from the standard size, signaling a need for process adjustment.
Health Metrics Evaluation: In healthcare, Z-scores are often used to interpret medical measurements, like blood pressure or cholesterol levels, compared to a standardized population average. This helps in identifying abnormal values that might require medical attention.
Sports Performance Metrics: In sports analytics, Z-scores can evaluate an athlete’s performance in different areas, such as speed or agility, relative to a defined group norm, assisting coaches in identifying strengths and areas for improvement.
Common Mistakes and How to Avoid Them
Calculating Z-scores on a TI-84 calculator is a process that, while straightforward, can be prone to specific errors. Awareness of these common mistakes can significantly enhance the accuracy of your calculations.
Incorrect Data Entry: The most fundamental step is entering your data correctly. Ensure each data point is accurately inputted into the list. A single error can significantly skew your Z-score calculation.
Misunderstanding the Formula: Remember, the Z-score formula is Z = (X – μ) / σ. Mixing up the mean (μ) and the data point (X) or using the wrong standard deviation (σ) can lead to incorrect results. Double-check your formula before proceeding.
Overlooking Negative Z-Scores: A negative Z-score indicates that the data point is below the mean. This is a normal part of analysis but is sometimes mistakenly seen as an error. Recognize that both positive and negative Z-scores are meaningful.
Forgetting to Clear Previous Data: The TI-84 retains data from previous calculations. Always clear old data before starting a new calculation to prevent any mix-up or confusion.
Misinterpreting the Results: A high or low Z-score doesn’t inherently mean something is wrong with the data. It’s a measure of deviation from the mean, and its interpretation depends on the context of your analysis.
Advanced Tips and Tricks
Mastering the TI-84 calculator for Z-score calculations involves more than just the basic steps. Here, we delve into additional features of the TI-84 that are particularly relevant for Z-scores and ways to leverage these for more complex statistical analysis.
Using the “Stats/List Editor” for Large Datasets: Manually entering data can be time-consuming for extensive data sets. The TI-84’s Stats/List Editor allows quicker data input and manipulation, making it easier to manage large quantities of data efficiently.
Programming for Repeated Calculations: Consider using or creating a basic program on the TI-84 if you frequently calculate Z-scores for similar datasets. This can automate the calculation process, saving time and reducing the potential for manual errors.
Graphing for Visualization: The TI-84 isn’t just for numerical calculations; it’s also powerful for data visualization. Use the graphing function to plot your data points along with their Z-scores. This visual representation can be beneficial for identifying outliers or understanding data distribution.
Leveraging the “Data Analysis” Tool: This feature offers more in-depth analysis capabilities, including regression analysis and hypothesis testing, which can complement your understanding of Z-scores in the context of broader statistical studies.
Matrix Functions for Multivariate Data: When dealing with multivariate data, the matrix functions of the TI-84 can be utilized to calculate Z-scores across different dimensions, providing a more comprehensive analysis.
Ad Title
Ad description. Lorem ipsum dolor sit amet, consectetur adipiscing elit.
Conclusion
Throughout this comprehensive guide, we’ve explored the fundamental process of calculating Z-scores on a TI-84 calculator, a crucial skill in statistical analysis. From understanding the basic concept of Z-scores and their significance in different sectors to navigating through the detailed steps of computation on the TI-84, this guide has aimed to provide a clear and thorough understanding.
We’ve highlighted the common pitfalls in the calculation process and how to avoid them, ensuring accuracy in your results. Moreover, the advanced tips and tricks section aims to enhance your analytical capabilities, empowering you to handle more complex data sets and broaden your analytical skills.
The TI-84 calculator, with its robust statistical functions, is a valuable tool for students and professionals in data analysis. We encourage you to experiment with Z-score calculations on your TI-84, exploring its various features and capabilities. The practical application of these skills will reinforce your understanding and enhance your proficiency in statistical analysis.
Recommended Articles
Are you looking to deepen your understanding of statistical calculations? Explore our blog for more insightful articles on topics like Z-scores and beyond.
Frequently Asked Questions (FAQs)
Q1: Why are Z-scores significant in statistics? Z-scores allow for data standardization, enabling comparison across different data sets.
Q2: Can the TI-84 calculator compute Z-scores for any data set? Yes, provided the correct data input and commands are used.
Q3: What is the primary function of a Z-score? It measures the number of standard deviations a data point is from the mean.
Q4: How accurate are Z-score calculations on a TI-84? Highly precise, assuming the correct data and formulas are input.
Q5: Are there any prerequisites to calculating Z-scores on a TI-84? Basic knowledge of statistics and calculator functions is helpful.
Q6: Can Z-scores be negative? Yes, a negative Z-score indicates a value below the mean.
Q7: How do I interpret a high Z-score? A high Z-score suggests a data point is significantly above the mean.
Q8: What is the error margin in TI-84 Z-score calculations? The margin is minimal if data entry and formula usage are correct.
Q9: Can Z-scores be calculated for an extensive data set on a TI-84? Yes, though it may require additional steps for data entry.
Q10: How can Z-scores help in real-world data analysis? They are crucial for standardizing data, especially in research and academia.