Histogram Skewed Right: Unveiling the Truth Behind Asymmetrical Data
You will learn the pivotal role of right-skewed histograms in unveiling hidden patterns within asymmetrical data.
Introduction
In the vast data analysis landscape, where numbers tell the tales of trends, patterns, and anomalies, the humble histogram stands out as a beacon of clarity, transforming complex datasets into visual narratives. Among its various forms, the histogram skewed right captures our attention, revealing the subtle intricacies of asymmetrical data distributions. This particular shape of the histogram, characterized by a concentration of data towards the left and a long tail stretching right, serves as a window into the underlying dynamics of datasets, from economic indicators to health outcomes.
At the heart of statistical analysis, histograms simplify the digestion of large data volumes and illuminate the path to deeper insights. The histogram skewed right especially beckons a closer examination, as it often harbors significant information in its rightward tail — from outliers that challenge norms to trends that shape decisions. As we embark on this exploration, our journey is twofold: to demystify the concept of right-skewed histograms for both novices and seasoned analysts and to underscore the practical implications of these distributions in real-world scenarios.
The objectives of this article are clear and ambitious. We aim to equip you with a robust understanding of histograms skewed right, enabling you to recognize and interpret such distributions and apply this knowledge in your analytical endeavors. Whether deciphering economic data, assessing health records, or unraveling environmental studies, the insights gained here will enhance your analytical prowess, guiding you toward informed decisions and discoveries that resonate with the essence of truth, utility, and innovation in data science.
By integrating real-world examples, including those derived from our specially curated dataset, we will bridge the gap between theoretical knowledge and practical application, ensuring a comprehensive grasp of histograms skewed right. Join us as we unveil the truth behind asymmetrical data, embracing the beauty and complexity of statistical analysis in our quest for deeper understanding and impactful applications.
Highlights
- Right-skewed histograms often indicate economic growth or positive financial trends.
- In health data, a right skew can signal rare but significant health outcomes.
- Environmental studies use right-skewed data to track rare but catastrophic events.
- Right-skewed histograms help in identifying outliers that can lead to innovative discoveries.
- In education data, right-skewed histograms may reflect a high achievement by a few.
Ad Title
Ad description. Lorem ipsum dolor sit amet, consectetur adipiscing elit.
The Foundations of Histograms
At its core, a histogram is a powerful graphical representation used in statistical analysis to depict the distribution of numerical data. It operates by grouping numbers into ranges, known as bins, and displaying the frequency of data points within each bin. This method transforms raw data into a visual story, making complex information accessible and interpretable at a glance.
Histograms are pivotal in data analysis, offering insights into data’s shape, spread, and central tendency. They are instrumental in identifying patterns, such as central clustering, skewness, and the presence of outliers, which are crucial for informed decision-making and hypothesis testing.
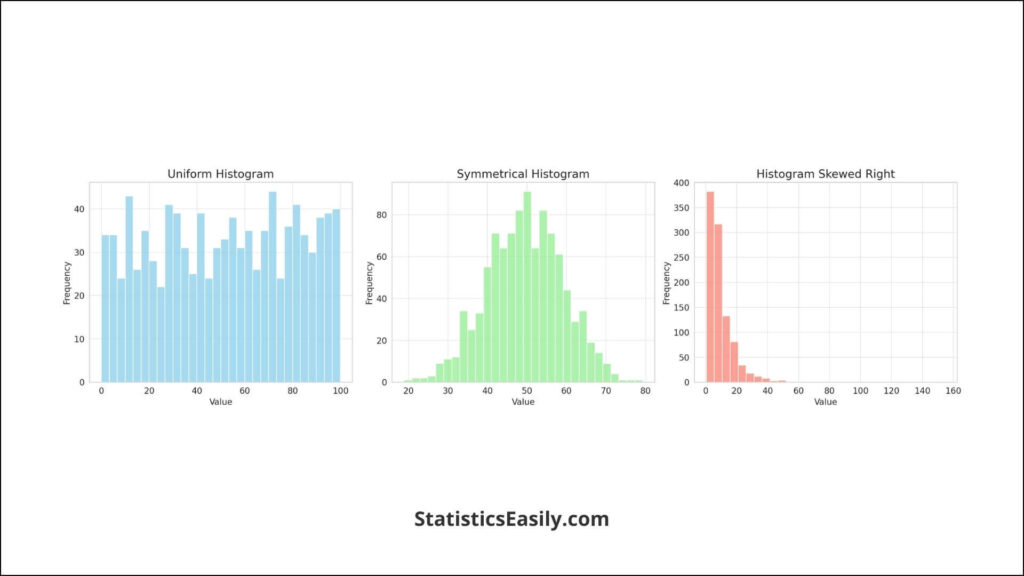
There are several types of histograms, each highlighting a different aspect of the data:
Uniform Histograms: Where each bin has a similar frequency, indicating an even distribution of data.
Symmetrical Histograms: Characterized by a mirror-like distribution around a central value, often signifying a normal distribution.
Skewed Histograms: These histograms lean towards one side, either right (positive skew) or left (negative skew). The histogram skewed right, our focus, is marked by a concentration of data on the left that tails off to the right. This skewness can reveal insights into the data’s underlying processes and anomalies.
The shape of a histogram is more than just a visual characteristic; it is a reflection of the data’s story. For instance, a histogram skewed right might indicate economic disparities within a population, where a large portion earns below the median income, and a smaller fraction earns significantly higher, pulling the mean to the right.
In interpreting histograms, it’s essential to consider the context of the data. The number of bins, the range of values, and the skewness all contribute to understanding the dataset’s nuances. A histogram skewed right often necessitates a deeper dive into the higher-value tail to understand the forces driving the skewness, whether natural, economic, or social.
Understanding ‘Skewness’ in Data
Skewness is a fundamental statistical concept that measures the asymmetry of a data distribution in a histogram. Unlike symmetrical distributions, where the data is evenly spread around the central peak, skewness indicates a distribution where the balance is disrupted. This leads to a tail that extends more prominently in one direction.
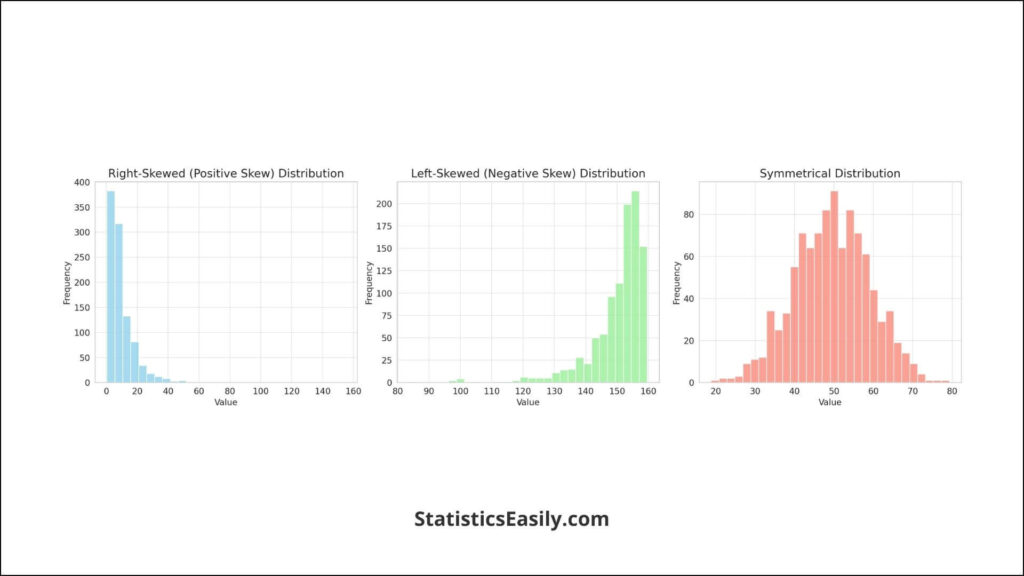
Right-Skewed (Positive Skew) Distributions: In a right-skewed histogram, the data accumulates towards the left side, with a tail stretching to the right. This is indicative of a dataset where most observations are lower in value. However, a few higher values pull the mean towards the tail. An example of a right-skewed distribution can be income levels within a population, where most individuals earn below the average. However, a few high earners increase the mean income.
Left-Skewed (Negative Skew) Distributions: Conversely, in a left-skewed histogram, the data is heavily piled on the right, with a tail extending to the left. This pattern suggests that most observations are high, with a minority of lower values pulling the mean towards the left. An example here might be the age at retirement, where most individuals retire at an older age. However, a few younger retirements skew the data leftward.
Symmetrical Distributions: Symmetrical histograms are characterized by data evenly distributed around a central point, showing no bias towards the left or right. This distribution often resembles the bell curve or normal distribution, where the mean, median, and mode are all at the center. Test scores in a well-designed exam, where most students perform around the average with equal numbers falling off on either side, can exemplify a symmetrical distribution.
Understanding skewness is crucial for interpreting histograms as it impacts statistical measures like mean, median, and mode. In a histogram skewed right, for instance, the mean is greater than the median due to the long tail of higher values, which can influence the analysis of central tendency and variability.
Delving into Right-Skewed Histograms
A histogram skewed to the right, also known as a positively skewed distribution, presents a unique profile where most data points are clustered to the left, with a tail extending significantly to the right. This visual representation is emblematic of a dataset where numerous observations are relatively low. Yet, a select few high values stretch the scale, pulling the mean towards the tail and away from the median.
Characteristics of Right-Skewed Histograms:
- Concentration on the Left: The bulk of data points are found on the lower end of the scale, indicating a prevalence of lower values within the dataset.
- Extended Right Tail: A noticeable tail extends towards the higher end of the value range, signifying the presence of outliers or exceptionally high values.
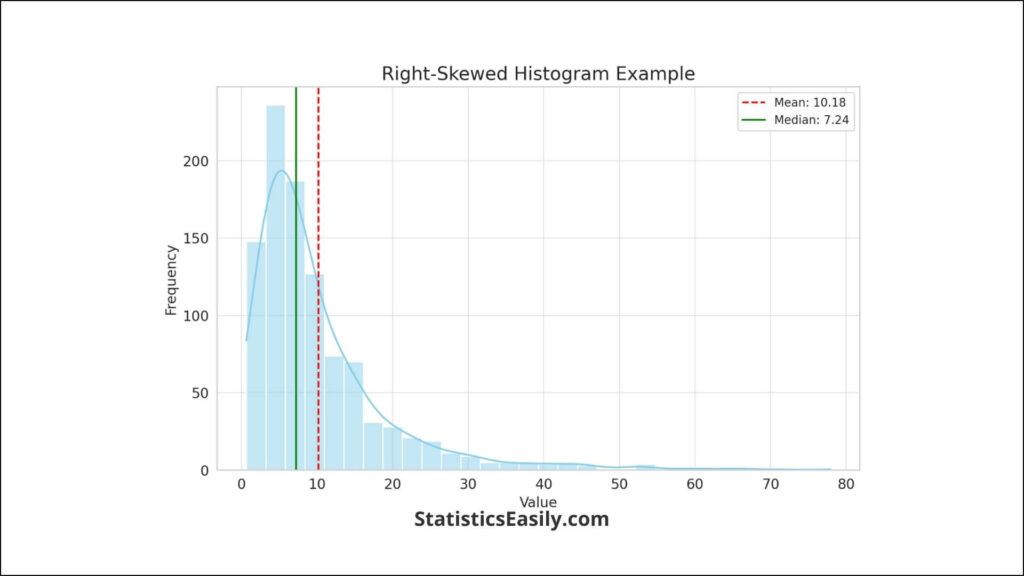
- Mean vs. Median: In such distributions, the mean is typically greater than the median due to the influence of high-value outliers, which can significantly shift the average.
Causes and Implications:
Right-skewness in histograms can arise from various real-world phenomena, especially when a natural boundary prevents values from falling below a certain point but allows for significant variation above it. For instance:
- Income Distribution: Often cited as a classic example, a large population segment might earn within a similar, lower-income bracket. At the same time, a smaller fraction has substantially higher earnings.
- Age at First Marriage: In many societies, there’s a minimum socially acceptable age for marriage, clustering a majority at the lower end, with fewer individuals marrying later in life, creating a right-skewed pattern.
- Website Traffic: For many websites, a few pages might attract disproportionately high views due to popularity or SEO. At the same time, the vast majority garner fewer hits.
Real-Life Applications:
Understanding the nature of right-skewed histograms is pivotal across various fields, from economics to health sciences, as it aids in recognizing the underlying distribution of data. For economists, recognizing a right-skewed distribution of wealth can inform policy decisions. A right-skewed histogram of patient ages for certain conditions can highlight demographic vulnerabilities in healthcare.
Practical Applications and Interpretations
Interpreting a histogram skewed to the right requires a nuanced understanding of its impact on statistical measures such as mean, median, and mode. In right-skewed distributions, the mean is often pulled towards the higher-value tail, diverging from the median that remains closer to the bulk of lower-value data. This disparity can significantly affect data analysis, emphasizing the need for a comprehensive approach that considers multiple measures of central tendency to capture the dataset’s characteristics accurately.
Impact on Mean, Median, and Mode:
- Mean: Elevated by high-value outliers, offering a higher average that might not represent the majority’s experience.
- Median: Provides a more resilient measure of central tendency, is less affected by outliers, and is often used as a more reliable indicator in right-skewed data.
- Mode: Represents the most frequent value, typically found at the peak of the data concentration on the left.
Relevance in Various Fields:
Right-skewed histograms are particularly relevant across diverse disciplines, where they assist in understanding and addressing asymmetrical data distributions:
- Economics: In wealth and income analysis, right-skewed histograms reveal disparities, guiding policies for equitable resource distribution.
- Environmental Science: Studies of rare but significant environmental events, such as extreme weather conditions, often yield right-skewed data, aiding in risk assessment and management.
- Health Data Analysis: Patient age distributions for specific diseases or treatment outcomes may be right-skewed, highlighting high-risk demographic groups and informing targeted healthcare strategies.
Interpreting Right-Skewed Histograms:
When faced with a right-skewed histogram, analysts are encouraged to:
- Examine the mean and median to understand the distribution’s central tendency and the influence of outliers.
- Consider the mode to identify the most common data points, which might differ significantly from the mean in right-skewed distributions.
- Analyze the tail to explore the nature and impact of outliers, understanding their potential to drive skewness and influence overall data interpretation.
Practical Example:
We can apply these principles to a right-skewed histogram representing, for instance, the distribution of household incomes within a community. Such an analysis might reveal a concentration of households earning below a certain threshold, with a few high-income outliers pushing the mean income upwards. Recognizing this skewness allows a more accurate representation of the community’s economic status, avoiding overestimating financial well-being based solely on the inflated mean.
Case Studies and Examples
The practical application of understanding histograms skewed to the right transcends theoretical knowledge, offering tangible insights into various fields. Through case studies, we can appreciate the profound impact of right-skewness in data interpretation and the consequential decisions based on these analyses.
Case Study 1: Economic Disparity Analysis
In examining household incomes within a specific region, the data revealed a histogram skewed to the right, highlighting a significant concentration of households earning below the median income level, with a sparse number of high-income outliers. This analysis prompted a reevaluation of economic policies, focusing on wealth redistribution and targeted support for low-income households, thereby fostering a more equitable economic environment.
Case Study 2: Public Health Planning
A health department’s review of patients’ ages for a particular chronic condition presented a right-skewed distribution, indicating a majority of younger patients with a tail of cases extending into older age groups. This insight led to strategically allocating healthcare resources and services, prioritizing preventive measures and education among younger demographics to mitigate long-term healthcare impacts.
Case Study 3: Educational Resource Allocation
An analysis of standardized test scores across various schools displayed a right-skewed histogram, with most students scoring around a median value but a few achieving exceptionally high scores. This distribution guided educational authorities to implement targeted programs for the median-scoring majority to elevate their performance and the high-achievers to nurture their potential, ensuring a balanced approach to educational development.
Overcoming Challenges in Analysis
Analyzing right-skewed histograms can present a unique set of challenges and misconceptions that, if not carefully navigated, may lead to misinterpretations and misguided conclusions. Understanding the nuances of right-skewed data is essential for accurate analysis and the derivation of meaningful insights.
Addressing Common Challenges:
- Mean vs. Median Misconception: A prevalent challenge in interpreting right-skewed histograms is the over-reliance on the mean as a measure of central tendency. Given the pull of outliers on the mean, it often misrepresents the data’s central value. Analysts are advised to consider the median, which better represents the dataset’s central tendency in right-skewed distributions, providing a more accurate depiction of most data points.
- Outlier Impact: High-value outliers in right-skewed histograms can significantly affect the distribution’s shape and statistical measures. Recognizing these outliers and understanding their influence is crucial. In some cases, additional analyses or transformations, such as logarithmic scaling, may be necessary to mitigate outlier effects and reveal the underlying data trends.
- Data Transformation Misunderstandings: Transforming right-skewed data to normalize distributions is common, especially in statistical modeling. However, the decision to transform should be carefully considered, understanding that it alters the data’s original scale and may impact the interpretation of results. Analysts must ensure that the transformed data accurately represents the phenomenon under study.
- Interpretation of Skewness: Another challenge is misinterpreting what right-skewness signifies about the dataset. Investigating the reasons behind the skewness is essential, considering the context and potential factors contributing to the distribution shape. This understanding can lead to more informed decisions and insights.
Expert Advice on Navigating These Issues:
- Utilize both graphical and numerical summaries to understand the data comprehensively. Combining histograms with central tendency and dispersion measures provides a fuller picture of the distribution.
- When outliers significantly skew the data, consider robust statistical measures or data transformation techniques to normalize the distribution, but always interpret these transformations cautiously.
- Always contextualize the data. Understanding the domain and context in which the data was collected can provide invaluable insights into why it is right-skewed and how to interpret it effectively.
Ad Title
Ad description. Lorem ipsum dolor sit amet, consectetur adipiscing elit.
Conclusion
This exploration of right-skewed histograms has provided a comprehensive understanding of their role in revealing complex patterns within various datasets, from economic indicators to health outcomes. Starting with an introduction to the basic concepts of right-skewed histograms, we have illuminated their significance in statistical analysis and the importance of accurately interpreting data distribution shapes. Through discussions on skewness, real-life applications, and practical case studies, we’ve highlighted the versatility and utility of right-skewed histograms in different fields, emphasizing their profound insights. Concluding with expert advice on overcoming analytical challenges, this journey underscores the importance of right-skewed histograms in deriving nuanced interpretations of data, encouraging a deeper engagement with asymmetrical data analysis to inform better decision-making.
Recommended Articles
Explore more on data analysis by diving into our other insightful articles. Uncover the beauty in data.
- Exploring Histogram Shapes: A Comprehensive Guide with Illustrations
- Scatterplot Mastery: Unveiling Patterns in Data Visualization
- Exploring Right-Skewed Histograms in Data Analysis
- Histograms vs Bar Graphs in Data Visualization
Frequently Asked Questions (FAQs)
Q1: What is a Histogram Skewed Right? It’s a data visualization where most values cluster to the left, with a tail extending to the right.
Q2: Why is Skewness Important in Data Analysis? Skewness helps in understanding data distribution, indicating potential outliers or biases.
Q3: How Can You Identify a Right-Skewed Histogram? Look for a longer tail on the right side of the histogram, with data piling up on the left.
Q4: What Causes a Histogram to be Skewed Right? Factors like income distribution or natural phenomena can lead to a right-skewed distribution.
Q5: How Does Right-Skewness Affect Mean and Median? In a right-skewed histogram, the mean is often greater than the median due to high values in the tail.
Q6: Can Right-Skewed Data Be Normalized? Yes, transformations like logarithmic can help normalize right-skewed data for better analysis.
Q7: What is the Impact of Right-Skewed Data in Healthcare? It can highlight rare diseases or outcomes requiring special medical research attention.
Q8: How Do Right-Skewed Histograms Relate to Environmental Studies? They can indicate the frequency of extreme weather events, aiding in climate change research.
Q9: What Statistical Tests are Suitable for Right-Skewed Data? Non-parametric tests like the Mann-Whitney U test can be more appropriate for skewed data.
Q10: How Can Right-Skewed Histograms Inform Educational Policies? They can show the distribution of student performances, highlighting the need for targeted interventions.